Multiple Choice
 Refer to the above diagram for good X. A shift from D2 to D1 would best be explained by:
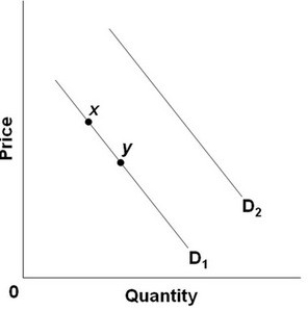
A) an increase in the price of good X.
B) a decrease in the price of good X.
C) an increase in the price of a complementary good Y.
D) an increase in the price of a substitute good Z.
Correct Answer:
Verified
Related Questions

