What could the following graph reasonably represent?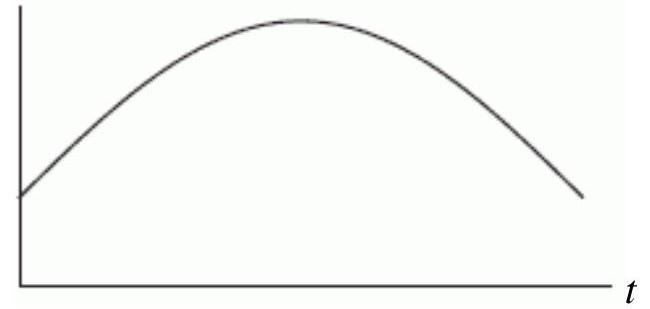
A) The average daily temperature of Denver over a one-year time period with being July 1.
B) The average daily temperature of Denver over a one-year time period with being January 1.
C) The population of Denver between 1900 and 2000 with being 1900 .
D) The infant mortality rate in Denver between 1900 and 2000 with being 1900.
Correct Answer:
Verified
Q7: Let
Q8: Write the relationship of population,
Q9: If you were to draw a
Q10: Consider the information in the following
Q11: You are looking at a graph
Q13: Which of the following graphs is mostly
Q14: You have Q15: Find the value of the expression Q16: Solve Q17: Let
Unlock this Answer For Free Now!
View this answer and more for free by performing one of the following actions

Scan the QR code to install the App and get 2 free unlocks

Unlock quizzes for free by uploading documents