Multiple Choice
Which of the following graphs is mostly likely to represent the resale price of a car which depreciates steadily until it is worthless?
A) 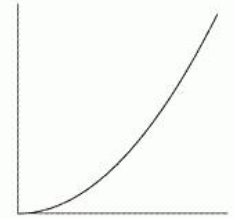
B) 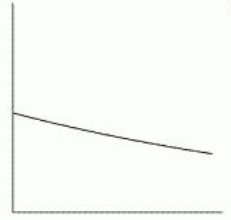
C) 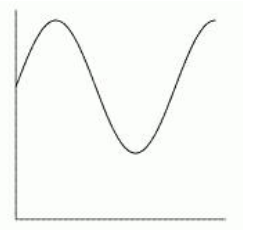
D) 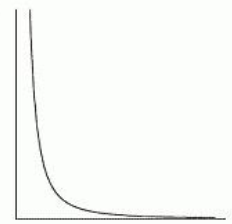
E) 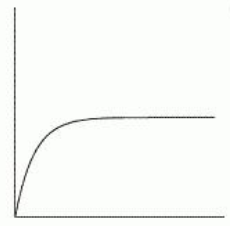
F) 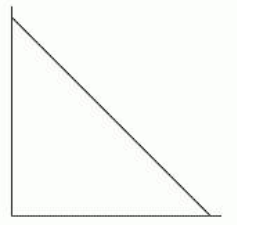
Correct Answer:
Verified
Related Questions
Q8: Write the relationship of population,
Q9: If you were to draw a
Q10: Consider the information in the following
Q11: You are looking at a graph
Q12: What could the following graph reasonably
Unlock this Answer For Free Now!
View this answer and more for free by performing one of the following actions

Scan the QR code to install the App and get 2 free unlocks

Unlock quizzes for free by uploading documents