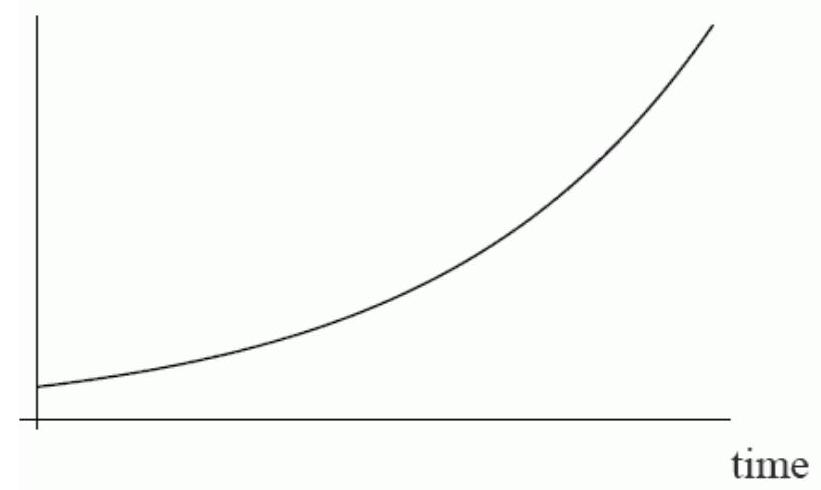
The number of bacteria in a sample grows slowly at first, but then grows with increasing rapidity. Does the following figure accurately represent the number of bacteria in a sample graphed against time?
Correct Answer:
Verified
Q115: For the function
Q116: Given the function
Q117: Given the function
Q118: Given the function
Q119: A model rocket is launched from
Q121: Which scenario below best matches the following
Q122: Calculate successive rates of change for
Q123: Calculate successive rates of change for
Q124: Does the following figure appear to be
Q125: Does the graph of
Unlock this Answer For Free Now!
View this answer and more for free by performing one of the following actions

Scan the QR code to install the App and get 2 free unlocks

Unlock quizzes for free by uploading documents