Calculate Successive Rates of Change for the Function Shown in the Following Table to Determine If the Graph
Calculate successive rates of change for the function shown in the following table to determine if the graph is more likely concave up or concave down for .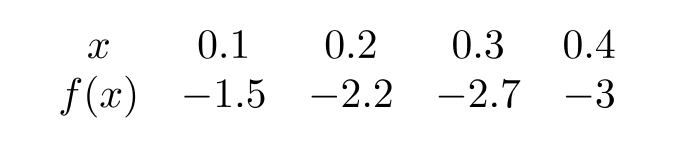
A) concave down
B) concave up
C) neither
Correct Answer:
Verified
Q118: Given the function
Q119: A model rocket is launched from
Q120: The number of bacteria in a sample
Q121: Which scenario below best matches the following
Q122: Calculate successive rates of change for
Q124: Does the following figure appear to be
Q125: Does the graph of
Q126: The car slowed down steadily. Which of
Q127: The pollution decreased more slowly as time
Q128: Determine the concavity of the graph
Unlock this Answer For Free Now!
View this answer and more for free by performing one of the following actions

Scan the QR code to install the App and get 2 free unlocks

Unlock quizzes for free by uploading documents