Use the pictograph to answer the question.
-For selected countries, this pictograph shows approximately how many kilograms of seafood are consumed by each person (per capita) annually.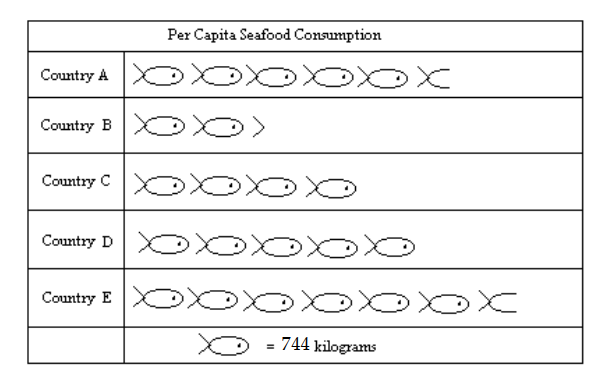
People in Country D eat approximately what percent more seafood than people in Country C?
A)
B)
C)
D)
Correct Answer:
Verified
Q9: The following table contains information about
Q10: The following table contains information about
Q11: Use the pictograph to answer the question.
-For
Q12: Use the pictograph to answer the question.
-For
Q13: Use the pictograph to answer the question.
-For
Q15: Use the pictograph to answer the question.
-This
Q16: Use the pictograph to answer the
Q17: Use the pictograph to answer the
Q18: Use the pictograph to answer the
Q19: Use the pictograph to answer the question.
-This
Unlock this Answer For Free Now!
View this answer and more for free by performing one of the following actions

Scan the QR code to install the App and get 2 free unlocks

Unlock quizzes for free by uploading documents