Use the pictograph to answer the question.
-This pictograph shows projected sales of compact disks (CDs) for a popular rock band for seven consecutive years.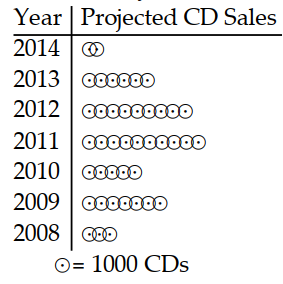
Between which two consecutive years is the greatest decline in sales indicated?
A) Between 2009 and 2010
B) Between 2013 and 2014
C) Between 2012 and 2013
D) Between 2010 and 2011
Correct Answer:
Verified
Q14: Use the pictograph to answer the
Q15: Use the pictograph to answer the question.
-This
Q16: Use the pictograph to answer the
Q17: Use the pictograph to answer the
Q18: Use the pictograph to answer the
Q20: Use the circle graph to solve
Q21: Use the circle graph to solve
Q22: Use the circle graph to solve the
Q23: Use the circle graph to solve
Q24: Use the circle graph to solve the
Unlock this Answer For Free Now!
View this answer and more for free by performing one of the following actions

Scan the QR code to install the App and get 2 free unlocks

Unlock quizzes for free by uploading documents