Use the graph to answer the question.
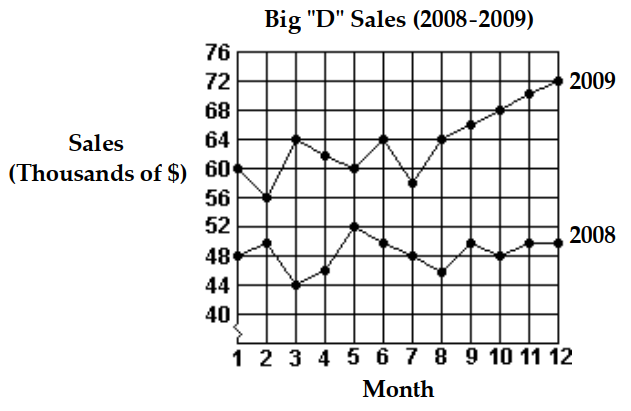
-What was the percent of increase in sales between month 2 and month 12 of 2009 ? Round your answer to the nearest tenth.
A)
B)
C)
D)
\section*{SHORT ANSWER. Write the word or phrase that best completes each statement or answers the question.}
Make a line graph of the data in the table.
Correct Answer:
Verified
Q58: Use the graph to answer the
Q59: Use the graph to answer the
Q60: Use the graph to answer the
Q61: Use the graph to answer the
Q62: Use the graph to answer the
Q64: Make a line graph of the data
Q65: Make a line graph of the data
Q66: Make a line graph of the
Q67: Make a line graph of the data
Q68: Make a line graph of the data
Unlock this Answer For Free Now!
View this answer and more for free by performing one of the following actions

Scan the QR code to install the App and get 2 free unlocks

Unlock quizzes for free by uploading documents