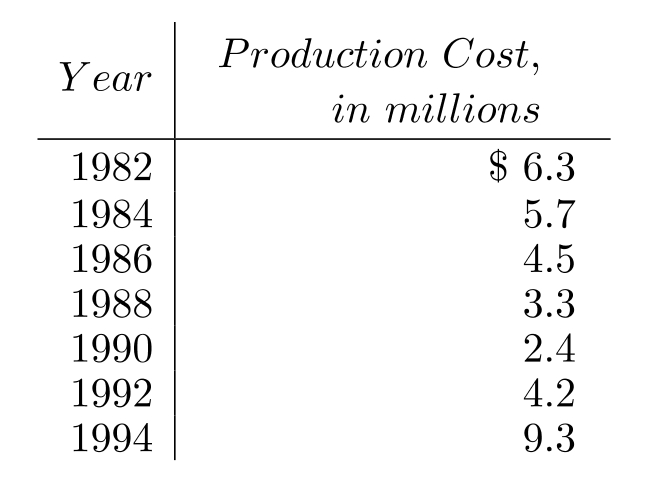
Make a line graph of the data in the table.
-The following table gives the average cost of producing a music video over the given years. Use time on the horizontal scale for your line graph.
Correct Answer:
Verified
View Answer
Unlock this answer now
Get Access to more Verified Answers free of charge
Q62: Use the graph to answer the
Q63: Use the graph to answer the
Q64: Make a line graph of the data
Q65: Make a line graph of the data
Q66: Make a line graph of the
Q68: Make a line graph of the data
Q69: For the set of numbers, find
Q70: For the set of numbers, find
Q71: For the set of numbers, find the
Q72: Find the mean.
-
Unlock this Answer For Free Now!
View this answer and more for free by performing one of the following actions

Scan the QR code to install the App and get 2 free unlocks

Unlock quizzes for free by uploading documents