Use the pictograph to answer the question.
-For selected countries, this pictograph shows approximately how many kilograms of seafood is consumed by each person (per capita) annually.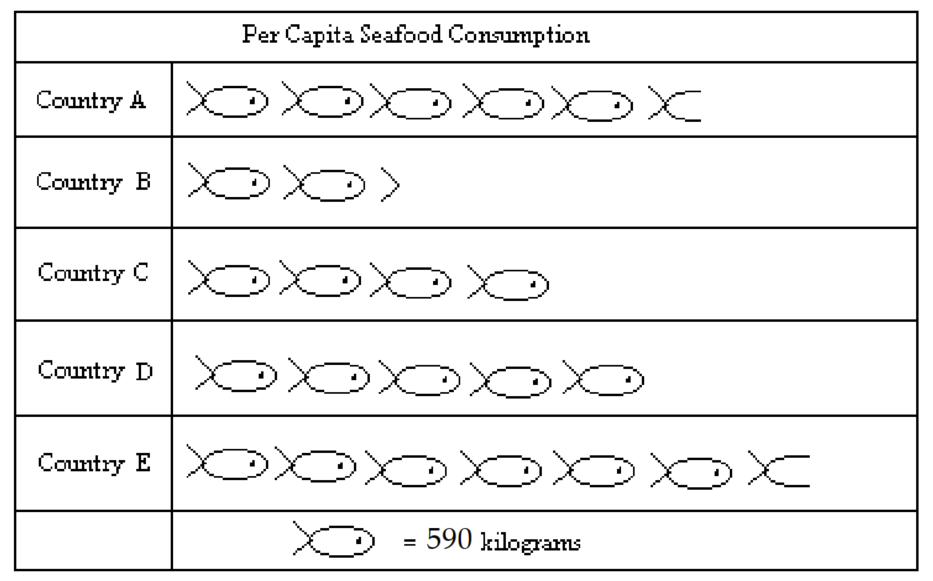
People in Country D eat approximately what percent more seafood than people in Country C?
A)
B)
C)
D)
Correct Answer:
Verified
Q60: Use the table to solve the problem.
-The
Q61: Use the table to solve the
Q62: Use the pictograph to answer the question.
-For
Q63: Use the pictograph to answer the question.
-For
Q64: Use the pictograph to answer the question.
-For
Q66: Use the pictograph to answer the question.
-This
Q67: Use the pictograph to answer the
Q68: Use the pictograph to answer the
Q69: Use the pictograph to answer the
Q70: Use the pictograph to answer the question.
-This
Unlock this Answer For Free Now!
View this answer and more for free by performing one of the following actions

Scan the QR code to install the App and get 2 free unlocks

Unlock quizzes for free by uploading documents