Use the pictograph to answer the question.
-This pictograph shows projected sales of compact disks (CDs) for a popular rock band for seven consecutive years.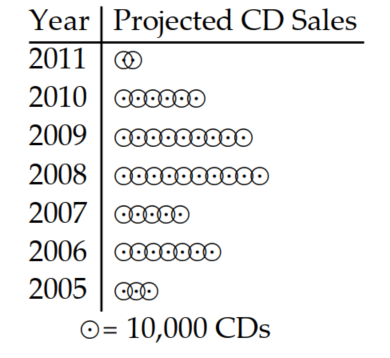
Between which two years was there the greatest decline in sales?
A) Between 2009 and 2010
B) Between 2010 and 2011
C) Between 2006 and 2007
D) Between 2007 and 2008
Correct Answer:
Verified
Q65: Use the pictograph to answer the
Q66: Use the pictograph to answer the question.
-This
Q67: Use the pictograph to answer the
Q68: Use the pictograph to answer the
Q69: Use the pictograph to answer the
Q71: Use the pictograph to answer the
Q72: The bar graph below shows the number
Q73: The bar graph below shows the number
Q74: The bar graph below shows the number
Q75: The bar graph below shows the number
Unlock this Answer For Free Now!
View this answer and more for free by performing one of the following actions

Scan the QR code to install the App and get 2 free unlocks

Unlock quizzes for free by uploading documents