Essay
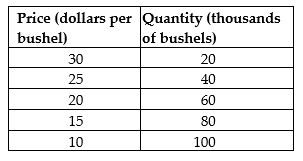
Use the following demand schedule for apples to draw a graph of the demand curve. Be sure to label the demand curve and each axis, and show each point on the demand curve.
Correct Answer:
Verified
Related Questions
Q6: Which of the following generation categories has
Q7: Factors that will tend to lead to
Q8: How does the decreasing use of DVD
Q9: If consumers believe the price of OLED
Q10: For each of the following pairs of
Q12: A decrease in the price of dashboard
Q13: As a result of fracking, _ had
Q14: Use the following supply schedule for cherries
Unlock this Answer For Free Now!
View this answer and more for free by performing one of the following actions

Scan the QR code to install the App and get 2 free unlocks

Unlock quizzes for free by uploading documents