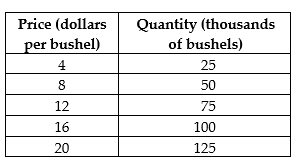
Use the following supply schedule for cherries to draw a graph of the supply curve. Be sure to label the supply curve and each axis, and show each point on the supply curve.
Correct Answer:
Verified
Q9: If consumers believe the price of OLED
Q10: For each of the following pairs of
Q11: Use the following demand schedule for apples
Q12: A decrease in the price of dashboard
Q13: As a result of fracking, _ had
Q15: Q16: Nearly one-fifth of China's 1.4 billion people Q17: Positive technological change in the production of Q18: "The price of LED light bulbs fell Q19: ![]()
![]()
Unlock this Answer For Free Now!
View this answer and more for free by performing one of the following actions

Scan the QR code to install the App and get 2 free unlocks

Unlock quizzes for free by uploading documents