In the tables below, population (not sample) means are given for the cells. In each case, compute the marginal means and indicate whether the table shows (1) a main row effect, (2) a main column effect, (3) an interaction effect. Remember: population values do not show the effects of sampling variation. 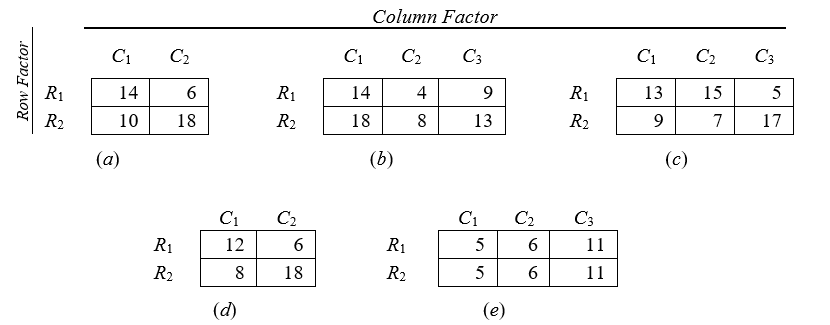
Correct Answer:
Verified
Q2: (a) -(e)Draw a graph of the cell
Q3: Thirty words are flashed on a screen,
Q4: Two approaches, S (structured) and U (unstructured),
Q5: A human factors psychologist investigates which of
Q6: Which is not an advantage of two-factor
Q7: In terms of the two-way table layout
Q8: A main effect is most precisely described
Q9: We are studying the effect of two
Q10: In terms of the two-way table layout
Q11: Suppose, in a two-way analysis of variance,
Unlock this Answer For Free Now!
View this answer and more for free by performing one of the following actions

Scan the QR code to install the App and get 2 free unlocks

Unlock quizzes for free by uploading documents