The following figure shows the demand, marginal revenue, and marginal cost curves for a profit maximizing monopolist.
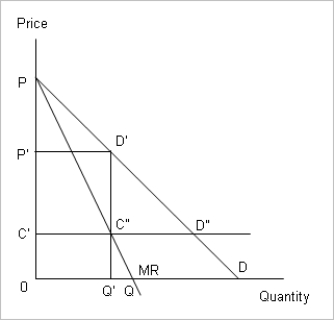
-Refer to Figure .Which of the following conclusions can be drawn from this figure?
A) The monopolist produces at the point where marginal cost is zero.
B) The monopolist incurs a fixed marginal cost of OC'.
C) The monopolist charges a price of OP' and total revenue is OP'D'Q'.
D) The consumer surplus enjoyed by customers is PC'D".
Correct Answer:
Verified
Q19: A monopolist charges $7 per unit for
Q20: A single-price monopolist produces closer to the
Q21: The following figure shows the demand, marginal
Q22: Which of the following is a possible
Q23: The following figure shows the demand curve
Q25:
A group of firms in competitive
Q26: X-inefficiency implies:
A)the practice of using less than
Q27: The following figure shows the demand curve
Q28: The following table shows the price
Q29: The peak of the total revenue curve
Unlock this Answer For Free Now!
View this answer and more for free by performing one of the following actions

Scan the QR code to install the App and get 2 free unlocks

Unlock quizzes for free by uploading documents