The following figure shows the demand curve and marginal revenue curve for a monopolist who incurs a marginal cost of $2 per unit.
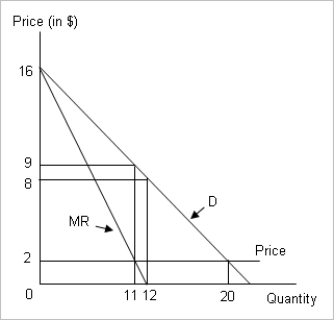
-Refer to Figure .What is the monopolist's revenue when he incurs a marginal cost of $2 per unit?
A) $99
B) $88
C) $96
D) $72
Correct Answer:
Verified
Q18: The greater the differences in demand elasticities
Q19: A monopolist charges $7 per unit for
Q20: A single-price monopolist produces closer to the
Q21: The following figure shows the demand, marginal
Q22: Which of the following is a possible
Q24: The following figure shows the demand, marginal
Q25:
A group of firms in competitive
Q26: X-inefficiency implies:
A)the practice of using less than
Q27: The following figure shows the demand curve
Q28: The following table shows the price
Unlock this Answer For Free Now!
View this answer and more for free by performing one of the following actions

Scan the QR code to install the App and get 2 free unlocks

Unlock quizzes for free by uploading documents