This graph shows the marginal cost and marginal benefit associated with roadside litter clean up. Assume that the marginal benefit curve and marginal cost curve each have their usual slope. 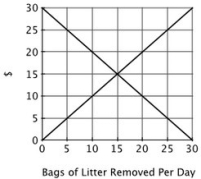 A state initiative requiring towns to spend at least $20 per day on litter removal would be ________ because ________.
A) efficient; reducing litter is socially optimal
B) inefficient; the marginal cost of litter removal would exceed the marginal benefit
C) inefficient; $20 is insufficient to remove all of the litter
D) efficient; it solves the inefficiency created by the negative externality
Correct Answer:
Verified
Q60: Suppose Erie Textiles can dispose of its
Q61: In order to achieve the socially optimal
Q62: A policy maker has argued for higher
Q63: This graph shows the marginal cost and
Q64: Suppose Erie Textiles can dispose of its
Q66: Which one of the following government actions
Q67: In order to achieve the socially optimal
Q68: This graph shows the marginal cost and
Q69: This graph shows the marginal cost and
Q70: If the marginal cost of reducing pollution
Unlock this Answer For Free Now!
View this answer and more for free by performing one of the following actions

Scan the QR code to install the App and get 2 free unlocks

Unlock quizzes for free by uploading documents