Refer to the figure below. From this graph, you can infer that paper production: 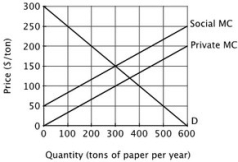
A) generates no externalities at quantities less than 300 tons per day.
B) generates an external cost of $50 per ton per year.
C) generates an external cost of $150 per ton per year.
D) should be prohibited.
Correct Answer:
Verified
Q93: Refer to the figure below. The socially
Q94: Refer to the figure below. Private incentives
Q95: Suppose that a vaccine is developed for
Q96: Numerous studies have shown that breathing second-hand
Q97: Refer to the figure below. The socially
Q99: Refer to the figure below. This graph
Q100: Which of the following would be most
Q101: The essential reason some species of whales
Q102: The following data show the relationship
Q103: If it is possible to place a
Unlock this Answer For Free Now!
View this answer and more for free by performing one of the following actions

Scan the QR code to install the App and get 2 free unlocks

Unlock quizzes for free by uploading documents