Refer to the figure below. The socially optimal quantity in this market is ________ units per day. 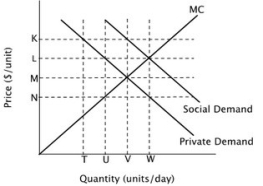
A) T
B) U
C) V
D) W
Correct Answer:
Verified
Q88: Refer to the figure below. The socially
Q89: Refer to the figure below. In this
Q90: Refer to the figure below. This graph
Q91: When the government imposes a tax on
Q92: The tendency for a resource that has
Q94: Refer to the figure below. Private incentives
Q95: Suppose that a vaccine is developed for
Q96: Numerous studies have shown that breathing second-hand
Q97: Refer to the figure below. The socially
Q98: Refer to the figure below. From this
Unlock this Answer For Free Now!
View this answer and more for free by performing one of the following actions

Scan the QR code to install the App and get 2 free unlocks

Unlock quizzes for free by uploading documents