The following graphic of residential housing data (selling price and size in square feet) is a ___. 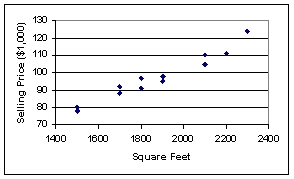
A) scatter plot
B) Pareto chart
C) pie chart
D) cumulative histogram
E) cumulative frequency distribuion
Correct Answer:
Verified
Q42: Pinky Bauer, Chief Financial Officer of
Q77: Each day, the office staff at Oasis
Q78: The staff of Mr. Wayne Wertz, VP
Q79: The staff of Mr. Wayne Wertz, VP
Q81: The United Nations Development Programme website provides
Q83: The total energy consumption (in kWh) for
Q84: There are four majors in the School
Q85: The following graphic of residential housing data
Q86: The total energy consumption (in kWh) for
Q87: The staff of Ms. Tamara Hill, VP
Unlock this Answer For Free Now!
View this answer and more for free by performing one of the following actions

Scan the QR code to install the App and get 2 free unlocks

Unlock quizzes for free by uploading documents