The following graphic of residential housing data (selling price and size in square feet) indicates ___. 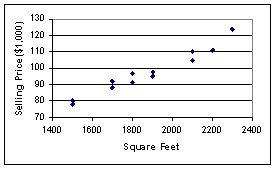
A) an inverse relation between the two variables
B) no relation between the two variables
C) a direct relation between the two variables
D) a negative exponential relation between the two variables
E) a sinusoidal relationship between the two variables
Correct Answer:
Verified
Q42: Pinky Bauer, Chief Financial Officer of
Q81: The United Nations Development Programme website provides
Q82: The following graphic of residential housing data
Q83: The total energy consumption (in kWh) for
Q84: There are four majors in the School
Q86: The total energy consumption (in kWh) for
Q87: The staff of Ms. Tamara Hill, VP
Q88: The staff of Mr. Wayne Wertz, VP
Q89: The staff of Ms. Tamara Hill, VP
Q90: The customer help center in your company
Unlock this Answer For Free Now!
View this answer and more for free by performing one of the following actions

Scan the QR code to install the App and get 2 free unlocks

Unlock quizzes for free by uploading documents