This graph illustrates the marginal costs and marginal benefits of acquiring information before making a major purchase. 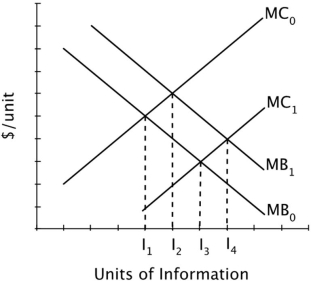 Suppose this graph describes a town in which the only way to gather any information about the good is through Consumer Reports. If the subscription price of Consumer Reports increases, then the impact of this could be portrayed by the marginal:
A) benefit curve shifting from MB0 to MB1.
B) cost curve shifting from MC1 to MC0.
C) benefit curve shifting from MB1 to MB0.
D) cost curve shifting from MC0 to MC1.
Correct Answer:
Verified
Q2: This graph illustrates the marginal costs and
Q2: Information about the quality of a product
Q3: Refer to the figure below. The growth
Q3: Sydney sells snow globes from a cart.
Q5: Suppose you are planning to sell your
Q6: The optimal amount of information to acquire
Q7: Refer to the figure below. If the
Q9: The reason the marginal benefit of information
Q19: Morgan lives in San Francisco and likes
Q20: According to the textbook, middlemen:
A)add no value
Unlock this Answer For Free Now!
View this answer and more for free by performing one of the following actions

Scan the QR code to install the App and get 2 free unlocks

Unlock quizzes for free by uploading documents