refer to the following diagram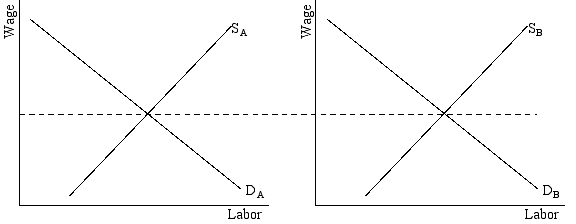
-Consider the two labor markets shown in the diagram above.The wage rates shown represent:
A) long run equilibrium
B) long run equilibrium if all nonwage aspects of the jobs are identical
C) long run equilibrium provided the workers are in noncompeting groups
D) long run equilibrium if information is perfect and costless
Correct Answer:
Verified
Q2: In 2010,hourly pay (measured in U.S.dollars)was highest
Q3: refer to the diagram below, which represents
Q4: Which of the following research findings would
Q5: Of the following industries,2011 average hourly earnings
Q6: Of the following occupational groups,2011 average hourly
Q7: If job X pays more than identical
Q8: Heterogeneous jobs are those that:
A)pay identical wages
B)have
Q9: refer to the diagram below, which represents
Q10: Lower-paid workers often seem to have less
Q11: Suppose all workers are identical but working
Unlock this Answer For Free Now!
View this answer and more for free by performing one of the following actions

Scan the QR code to install the App and get 2 free unlocks

Unlock quizzes for free by uploading documents