The table below shows the age and annual income of 12 randomly selected college graduates all living in the same city. 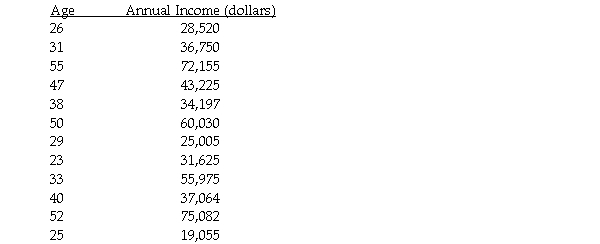
The scatter plot and regression equation are shown below: 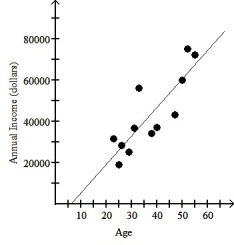
The regression analysis of this data yields the following values: 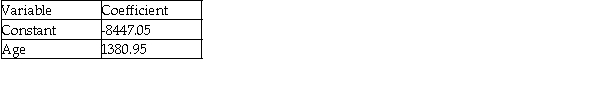
R2 = 0.7182
Use this model to predict the annual income of a 56 year old college graduate living in this city.
A) $77,333
B) $61,367
C) $85,780
D) $70,230
E) $68,886
Correct Answer:
Verified
Q14: The table below shows the gestation (in
Q15: The scatterplot below shows the percentage of
Q16: Which of the labeled points below are
Q17: Which of the labeled points below are
Q18: The figure below shows the association between
Q20: The figure below shows the life expectancy
Q22: A reporter studied the causes of a
Q23: An economist noticed that nations with more
Q24: Which of the following scatterplots of residuals
Q29: A university studied students' grades and established
Unlock this Answer For Free Now!
View this answer and more for free by performing one of the following actions

Scan the QR code to install the App and get 2 free unlocks

Unlock quizzes for free by uploading documents