Shown below is a concentration vs.time plot for the reaction A ⇌ B.For this reaction the value of the equilibrium constant is 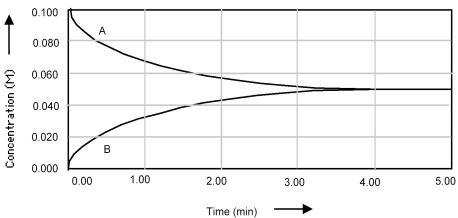
A) Kc < 1.
B) Kc = 0.
C) Kc = 1.
D) Kc > 1.
Correct Answer:
Verified
Q83: Shown below is a concentration vs.time plot
Q84: The following pictures represent mixtures of A2B4
Q85: The reaction A2 + B2 ⇌ 2AB
Q86: The reaction A2 + B2 ⇌ 2AB
Q87: Shown below is a concentration vs.time plot
Q89: Picture (1)represents the equilibrium mixture for the
Q90: The following pictures represent the initial state
Q91: Shown below is a concentration vs.time plot
Q92: The following picture represents the equilibrium state
Q93: Consider the reaction A + B ⇌
Unlock this Answer For Free Now!
View this answer and more for free by performing one of the following actions

Scan the QR code to install the App and get 2 free unlocks

Unlock quizzes for free by uploading documents