Multiple Choice
Refer to the diagrams below.The solid lines are production possibilities curves;the dashed lines are trading possibilities curves.The trading possibilities curves suggest that the terms of trade are: 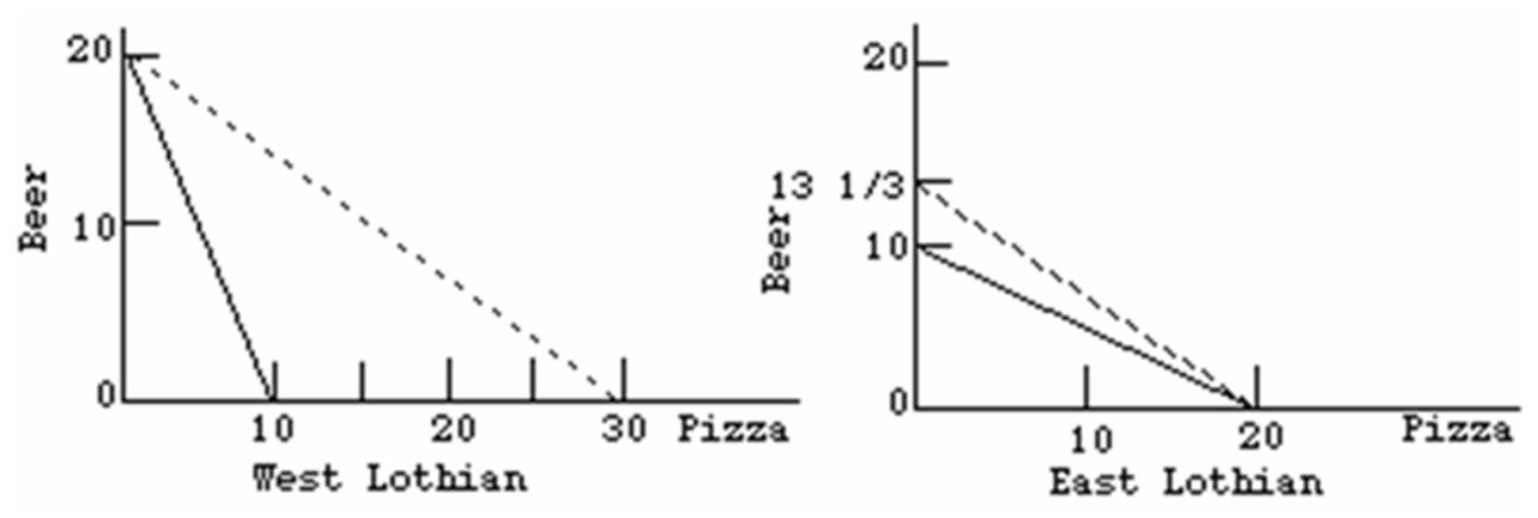
A) 1.5 beers for 1 pizza.
B) 1 beer for 2 pizzas.
C) 2 beers for 1 pizza.
D) 1 beer for 1.5 pizzas.
Correct Answer:
Verified
Related Questions
Q52: Production possibilities data for two countries,Alpha and
Q53: Refer to the diagram below in which
Q55: Refer to the tables below.Which of the
Q59: Production possibilities data for Gamma and Sigma.All
Unlock this Answer For Free Now!
View this answer and more for free by performing one of the following actions

Scan the QR code to install the App and get 2 free unlocks

Unlock quizzes for free by uploading documents