Multiple Choice
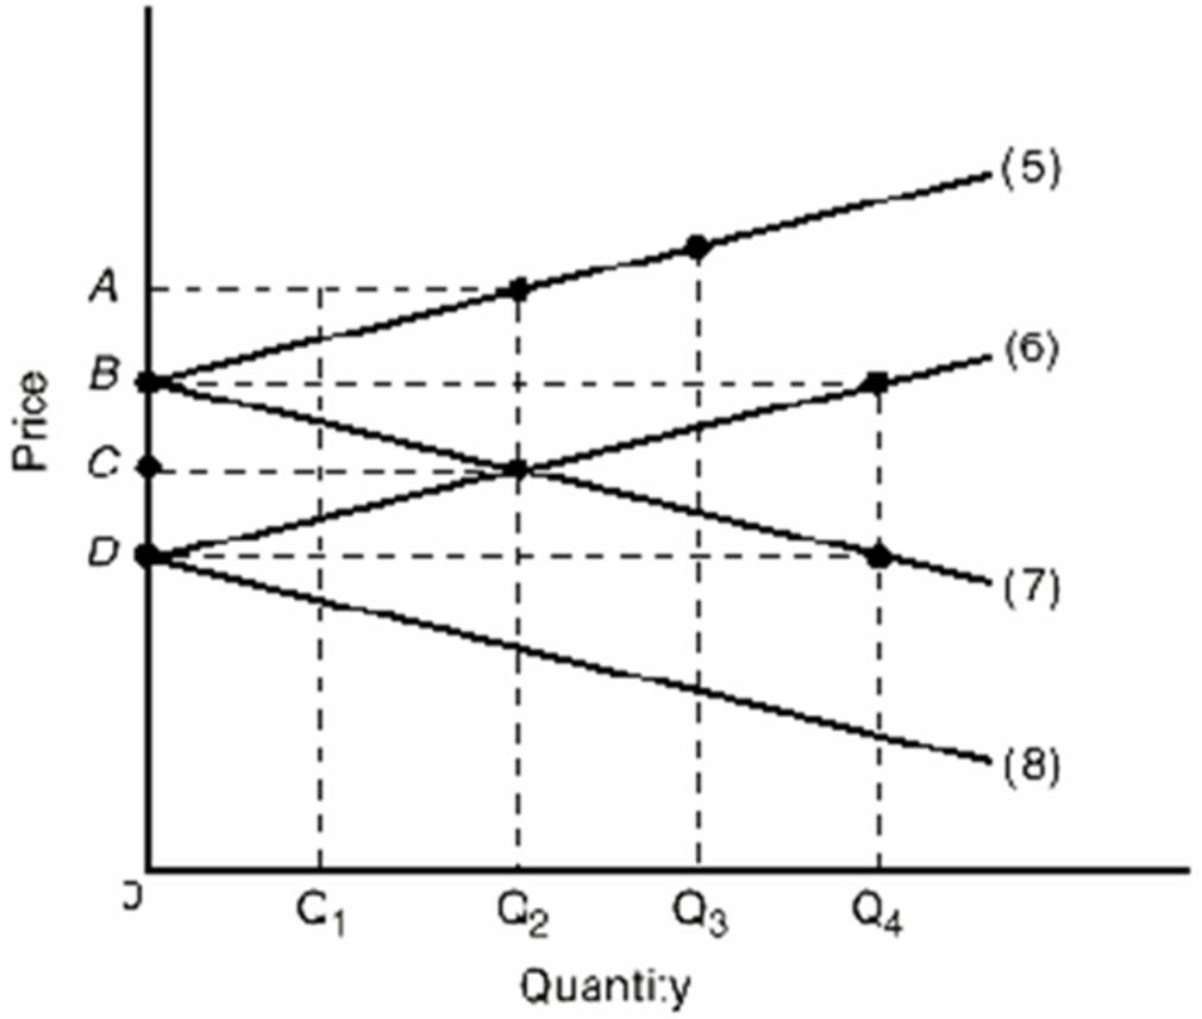
-Refer to the above graph which shows the import demand and export supply curves for two nations that produce a product.The export supply curves for the two nations are represented by lines:
A) 5 and 7.
B) 5 and 6.
C) 6 and 8.
D) 7 and 8.
Correct Answer:
Verified
Related Questions
Q57: Refer to the diagrams below.The solid lines
Q59: Production possibilities data for Gamma and Sigma.All

