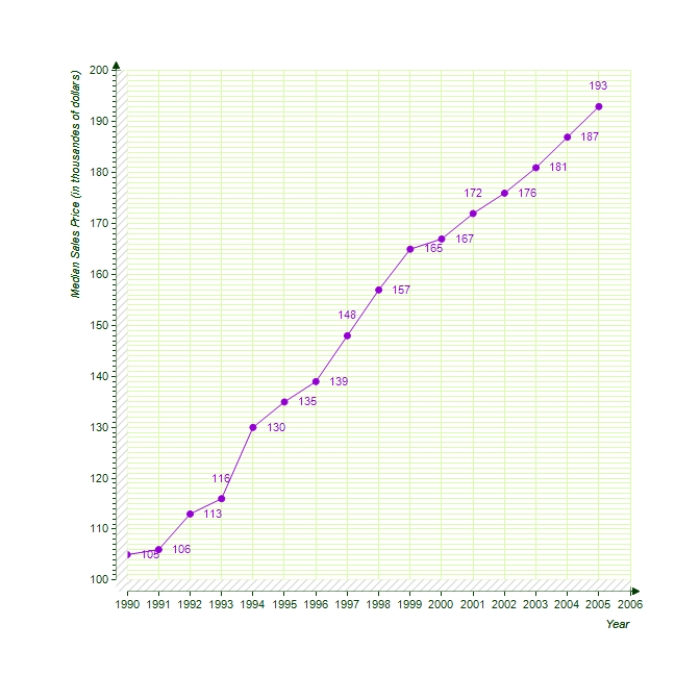
Assume that the median sales prices of existing one family homes sold (in thousands of dollars) in the United States from 1990 through 2005 are as given in the following figure.Use the following figure to estimate the percent increase in the value of existing one-family homes from1999 to 2000.Round your answer to the nearest hundredth if necessary.
A) 1.2%
B) 201.21%
C) 101.21%
D) 98.8%
E) 1.21%
Correct Answer:
Verified
Q2: Find x such that the distance between
Q3: Find the x- and y- intercepts of
Q4: Copy the points (-2,5),(3,-5),(-4,-1),(4,0),(2,-3)in the Cartesian plane.
Q5: Sketch the graph of the equation:
Q6: Write the general form of the equation
Q7: Assume that the number (in millions)of cellular
Q8: Assume that the number (in millions)of basic
Q9: Find the distance between the points (-2,-5)and
Q10: Sketch the graph of the equation.
Q11: Which of the following is the correct
Unlock this Answer For Free Now!
View this answer and more for free by performing one of the following actions

Scan the QR code to install the App and get 2 free unlocks

Unlock quizzes for free by uploading documents