Students were asked to make a histogram of the number of corn snakes collected in Will County,Illinois from 1985 to 2006.They were given the data in the form of a stem-and-leaf display shown below: = 57 corn snakes
One student submitted the following display: 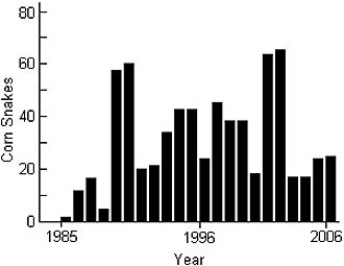 a)Comment on this graph.
b)Create your own histogram of the data.
Correct Answer:
Verified
View Answer
Unlock this answer now
Get Access to more Verified Answers free of charge
Q34: The mathematics department at a Canadian
Q35: A business owner recorded her annual
Q36: A student at a local university
Q37: The following stem-and-leaf display shows the
Q38: Shown below are the histogram and
Q40: A dotplot of the number of tornadoes
Q41: Here are the number of baseball games
Q42: Here are the grocery bills,in dollars,for
Q43: Jody got a bank statement each month
Q44: The histograms show the cost of living,in
Unlock this Answer For Free Now!
View this answer and more for free by performing one of the following actions

Scan the QR code to install the App and get 2 free unlocks

Unlock quizzes for free by uploading documents