The histograms show the cost of living,in dollars,for 32 U.S.cities.The histogram on the left shows the cost of living for the 32 cities using bins $10 wide,and the histogram on the right displays the same data using bins that are $6 wide.For which of the histograms would you most strenuously insist on using an IQR rather than a standard deviation to summarize spread? Explain. 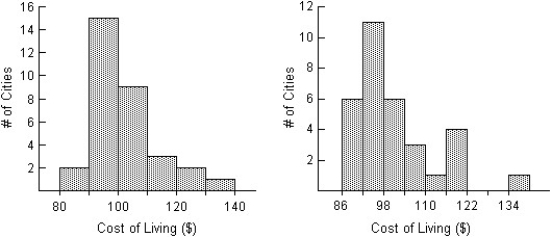
A) The histogram on the right is most nearly symmetric and shows no outliers.That makes it the best candidate for summarizing with an IQR.
B) The histogram on the left shows a low outlier.The standard deviation is sensitive to outliers,so we'd prefer to use the IQR for this one.
C) The histogram on the right shows a high outlier.The standard deviation is sensitive to outliers,so we'd prefer to use the IQR for this one.
D) The histogram on the left is most strongly skewed to the right.That makes it the best candidate for summarizing with an IQR.
E) The histogram on the left is most nearly symmetric and shows no outliers.That makes it the best candidate for summarizing with an IQR.
Correct Answer:
Verified
Q39: Students were asked to make a
Q40: A dotplot of the number of tornadoes
Q41: Here are the number of baseball games
Q42: Here are the grocery bills,in dollars,for
Q43: Jody got a bank statement each month
Q45: A consumer group surveyed the prices for
Q46: A small company employs a supervisor at
Q47: The students in a math class took
Q48: John liked to order the all-you-can-eat shrimp
Q49: The local Tupperware dealers earned the following
Unlock this Answer For Free Now!
View this answer and more for free by performing one of the following actions

Scan the QR code to install the App and get 2 free unlocks

Unlock quizzes for free by uploading documents