Consider Figure 12.14 below, which shows the price of oil from January 2005-December 2010. What are the impacts of this on the macroeconomy? In particular, which macroeconomic relationship does this impact? Explain.
Figure 12.14: Percent Change Oil Price 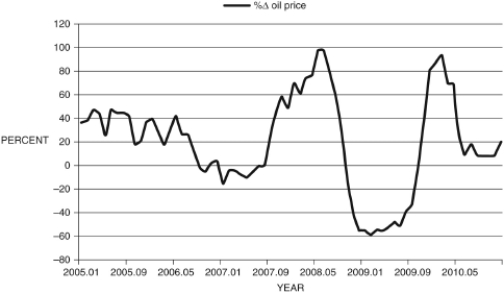
(Source: Federal Reserve Economic Data, St. Louis Federal Reserve)
Correct Answer:
Verified
View Answer
Unlock this answer now
Get Access to more Verified Answers free of charge
Q122: Figure 12.16: Output Q123: Figure 12.13 shows the yield curve for Q125: Figure 12.17: Real GDP and Non-Farm Employment Q126: In March and April 1980, inflation in Q127: Discuss the differences between the ex ante Q128: What tool does the U.S. Federal Reserve Q129: You've been asked to spend a week Q129: What are the mechanics of lowering interest Q133: The open-market operations desk is at the Q135: Refer to the following figure when answering![]()
Unlock this Answer For Free Now!
View this answer and more for free by performing one of the following actions

Scan the QR code to install the App and get 2 free unlocks

Unlock quizzes for free by uploading documents