The following table displays the top 40 American League batting averages of the 2011 season. 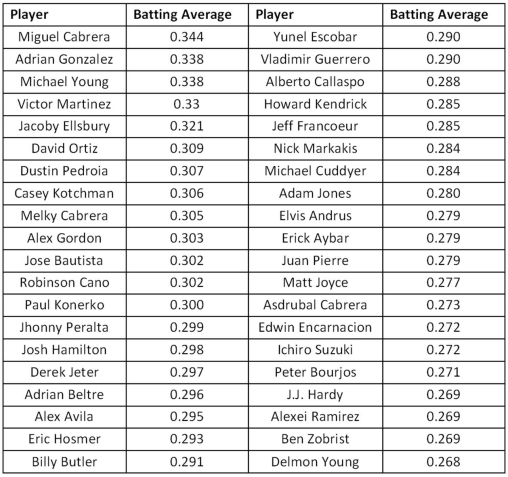 Source: http://www.espn.com
A)Construct frequency,relative frequency,and cumulative relative frequency distributions that group the data in classes of 0.265 up to 0.280,0.280 up to 0.295,0.295 up to 0.310,and so on.
B)How many of these players have a batting average above 0.340? What proportion of these players has a batting average of at least 0.280,but below 0.295? What percentage of these players has a batting average below 0.325?
C)Construct a relative frequency histogram.Is the distribution symmetric? If not,is it positively or negatively skewed?
D)Construct an ogive.
E)Using the ogive,approximately what proportion of the players in this group has a batting average above 0.290?
Correct Answer:
Verified
b.One player has a batting average ...
View Answer
Unlock this answer now
Get Access to more Verified Answers free of charge
Q89: Use the following data to construct a
Q90: A survey of 400 unemployed people was
Q91: The following table shows the prices (in
Q92: The accompanying cumulative relative frequency distribution shows
Q93: A car dealership created a scatterplot showing
Q94: A high school football league recorded the
Q95: Use the following data to construct a
Q96: Construct a stem-and-leaf diagram with the following
Q97: A hair stylist records the hair color
Q98: A statistics instructor computes the grade and
Unlock this Answer For Free Now!
View this answer and more for free by performing one of the following actions

Scan the QR code to install the App and get 2 free unlocks

Unlock quizzes for free by uploading documents