Multiple Choice
The graph of  represents the rate of change of rainfall during a severe thunderstorm t hours after rainfall began. Draw a graph of the total amount of rain that fell during this storm, using the following facts:
  The rainfall started at 2 P.M. and did not stop until 8 P.M.
  2 inches of rain fell between 2 P.M. and 5 P.M.
  The total amount of rain that fell during the storm was 5.2 inches.
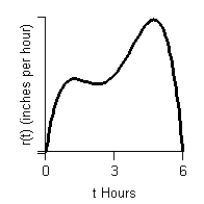
A) 
B) 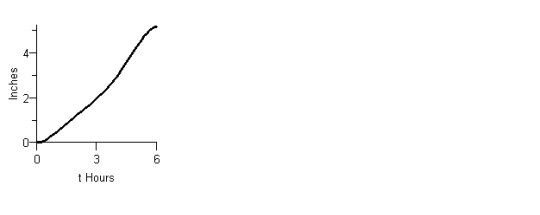
C) 
D) 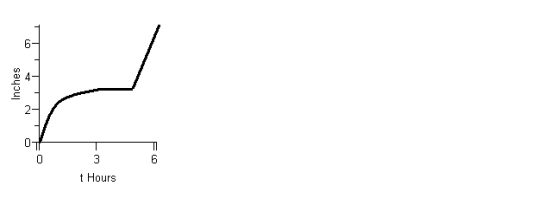
E) 
Correct Answer:
Verified
Related Questions

Unlock this Answer For Free Now!
View this answer and more for free by performing one of the following actions

Scan the QR code to install the App and get 2 free unlocks

Unlock quizzes for free by uploading documents