Consider the graph of r(t) , the rate of change in the price of a technology stock, during the first 55 days of trading of 2003. Using the information present below, find the graph of the accumulation function starting at day 16. 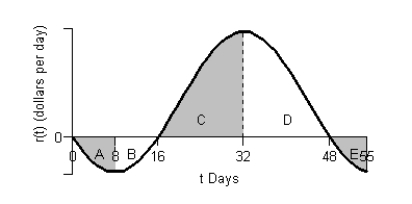

A) 
B) 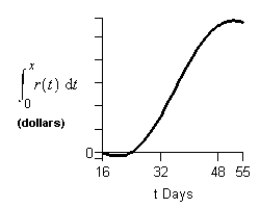
C) 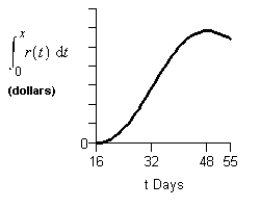
D) 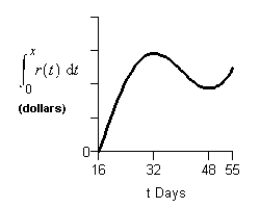
E) 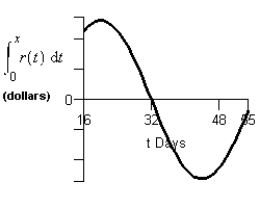
Correct Answer:
Verified
Q13: The graph of Q14: Suppose the rate of change of the Q15: Consider the graph of the function: Q16: The rate of change of the weight Q17: A table of selected values for a Q19: Consider the graph of the function: Q20: Consider the graph of r(t), the rate Q21: Find the indefinite integral. Q22: Suppose U.S. factory sales of electronic goods Q23: The cost of producing x units of![]()
![]()
Unlock this Answer For Free Now!
View this answer and more for free by performing one of the following actions

Scan the QR code to install the App and get 2 free unlocks

Unlock quizzes for free by uploading documents