Marsha used a graphing calculator to graph an expense and a revenue function for her family's printing business.The graph looked like the one below.What are the approximate breakeven points? 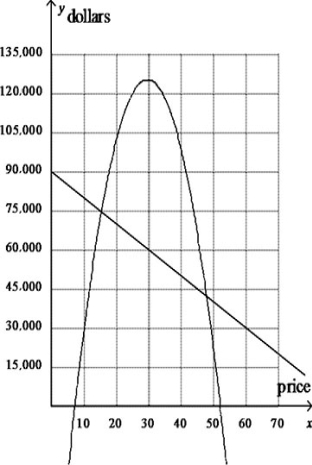
A) 75,000 and 38,000
B) 120,000 and 52
C) 15 and 47
D) 8 and 52
Correct Answer:
Verified
Q11: The dashed line represents the expense function,and
Q12: Jeff prepares meals in the home of
Q13: A demand function for step stools manufactured
Q14: The price that a manufacturer charges a
Q15: A trademark claims ownership of the idea
Q17: The graph shows the supply and demand
Q18: In the revenue equation R = -360p2
Q19: If you were doing a study,your class,sports
Q20: The costs for postage and packaging are
Q21: Custom Tees has determined that its variable
Unlock this Answer For Free Now!
View this answer and more for free by performing one of the following actions

Scan the QR code to install the App and get 2 free unlocks

Unlock quizzes for free by uploading documents