The graph shows the supply and demand curves for a Cajun spice mix that Leroy manufactures in a home business.What will happen if Leroy sets the price at $3.99? 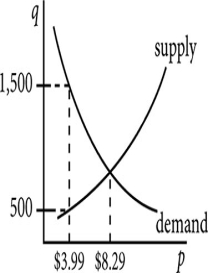
A) The supply will exceed the demand.
B) The demand will exceed the supply.
C) The market will be in equilibrium.
D) Five hundred spice mixes will be demanded.
Correct Answer:
Verified
Q12: Jeff prepares meals in the home of
Q13: A demand function for step stools manufactured
Q14: The price that a manufacturer charges a
Q15: A trademark claims ownership of the idea
Q16: Marsha used a graphing calculator to graph
Q18: In the revenue equation R = -360p2
Q19: If you were doing a study,your class,sports
Q20: The costs for postage and packaging are
Q21: Custom Tees has determined that its variable
Q22: Custom Tees has determined that its expense
Unlock this Answer For Free Now!
View this answer and more for free by performing one of the following actions

Scan the QR code to install the App and get 2 free unlocks

Unlock quizzes for free by uploading documents