Deck 12: Disparities in Long-Term Care Institutions
Full screen (f)
Question
Question
Question
Question
Question
Question
Question
Question
Question
Question
Question
Question
Based upon your analysis of Table 12.1 below, which statement(s) is/are correct interpretations of the data in 12.1.

A) The greatest amount of patients in the long-term industry are served by home health agencies. This is not surprising since this segment of the industry has the greatest number of providers.
B) Based upon the number of nursing home residents and the number of nursing homes in 2013-2014, the mean number of residents per home was almost 88.
C) Adult day care providers were probably a struggling component of the long-term care industry since there were 4,800 providers with only 282,200 participants or, a mean of nearly 59 participants per provider unless daily rate was costly enough to cover all costs and generate a profit.
D) a and b
E) b and c
F) None of the above
G) All of the above
Question
Question
Question
Question
Question
Quantitatively speaking, Table 12.2 reveals that:
TABLE 12.2 Informal Caregiving Differences by Race/Ethnicity, 2015

A) A greater percentage of Latino Americans provide informal long-term than any other ethnic group listed. A greater percentage of Latinos also provide 30 hours more of care per week than any other racial/ethnic group
B) A lower percent of Asian Americans provide informal long-term care than any other group. However, the Asian Americans have the second highest proportion of caretakers who spend a mean of 30 hours or more.
C) The percentage differences between the mean age of caretakers for Americans of European descent and those of African descent is less than 5%
D) a and b
E) b and c
F) a, b and c are true
G) None of the above are true
TABLE 12.2 Informal Caregiving Differences by Race/Ethnicity, 2015
A) A greater percentage of Latino Americans provide informal long-term than any other ethnic group listed. A greater percentage of Latinos also provide 30 hours more of care per week than any other racial/ethnic group
B) A lower percent of Asian Americans provide informal long-term care than any other group. However, the Asian Americans have the second highest proportion of caretakers who spend a mean of 30 hours or more.
C) The percentage differences between the mean age of caretakers for Americans of European descent and those of African descent is less than 5%
D) a and b
E) b and c
F) a, b and c are true
G) None of the above are true
Question
Question
Question
Question
Question
Question
Question
Question
Question
Question
Question
Question
Please review the table from the Appendix to this chapter which has been included below. Then answer the questions to assess whether you are correctly reading and interpreting the data.
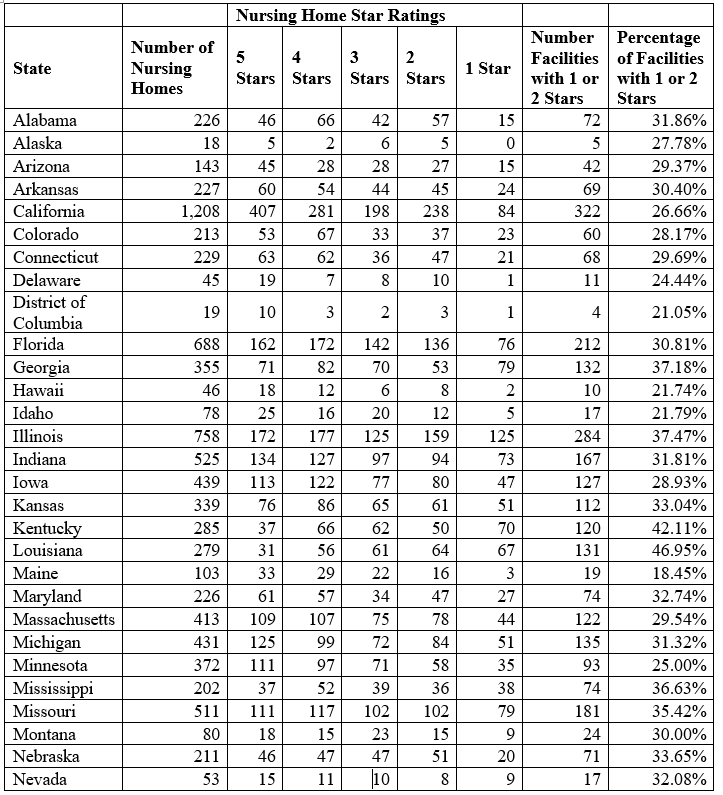
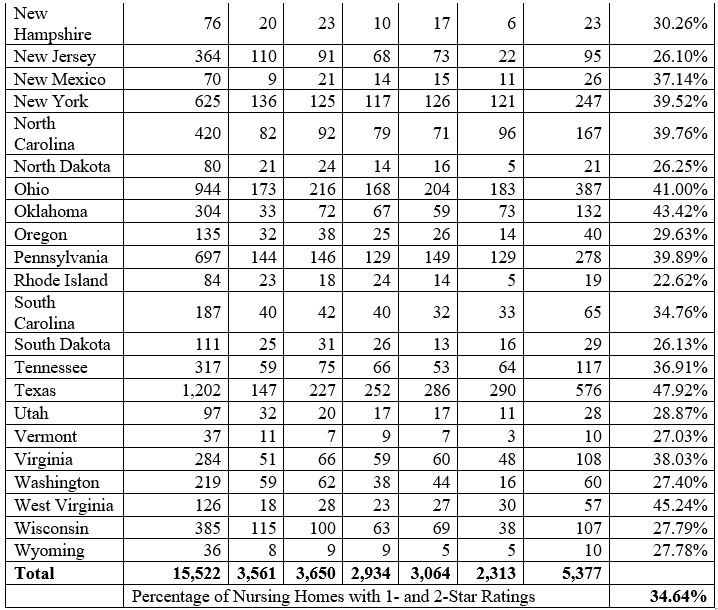
-The states with the greatest number of nursing homes in 2015 were:
A) California, Texas, and Florida
B) Ohio, Texas, and Florida
C) Illinois, Texas and Florida
D) None of the above
-The states with the greatest number of nursing homes in 2015 were:
A) California, Texas, and Florida
B) Ohio, Texas, and Florida
C) Illinois, Texas and Florida
D) None of the above
Question
Please review the table from the Appendix to this chapter which has been included below. Then answer the questions to assess whether you are correctly reading and interpreting the data.
-Approximately __% of the nursing homes had 4 or 5 star ratings.
A) 22.94%
B) 23.51%
C) 46.46%
D) None of the above
-Approximately __% of the nursing homes had 4 or 5 star ratings.
A) 22.94%
B) 23.51%
C) 46.46%
D) None of the above
Question
Please review the table from the Appendix to this chapter which has been included below. Then answer the questions to assess whether you are correctly reading and interpreting the data.
-The percentage of nursing homes with 4 of 5 star ratings:
A) Was less than the percentage with 1 or 2 star ratings
B) Was more than the percentage with 1 or 2 star ratings
C) Was equal to the percentage with 1 or 2 star ratings
D) None of the above
-The percentage of nursing homes with 4 of 5 star ratings:
A) Was less than the percentage with 1 or 2 star ratings
B) Was more than the percentage with 1 or 2 star ratings
C) Was equal to the percentage with 1 or 2 star ratings
D) None of the above
Question
Please review the table from the Appendix to this chapter which has been included below. Then answer the questions to assess whether you are correctly reading and interpreting the data.
-The objective of the quantitative case study in Chapter 12 is to:
A) Demonstrate how to take data and convert it into information and to convert the information into new knowledge
B) Ensure that students see how badly the nursing home industry is performing
C) Both a and b
D) None of the above
-The objective of the quantitative case study in Chapter 12 is to:
A) Demonstrate how to take data and convert it into information and to convert the information into new knowledge
B) Ensure that students see how badly the nursing home industry is performing
C) Both a and b
D) None of the above
Question
Please answer the next several questions using Table 12.4 below which contains data for 2015.
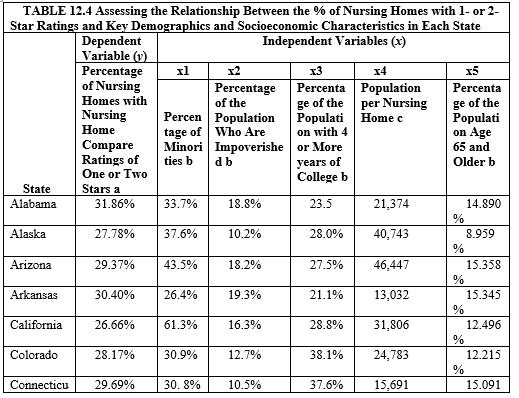
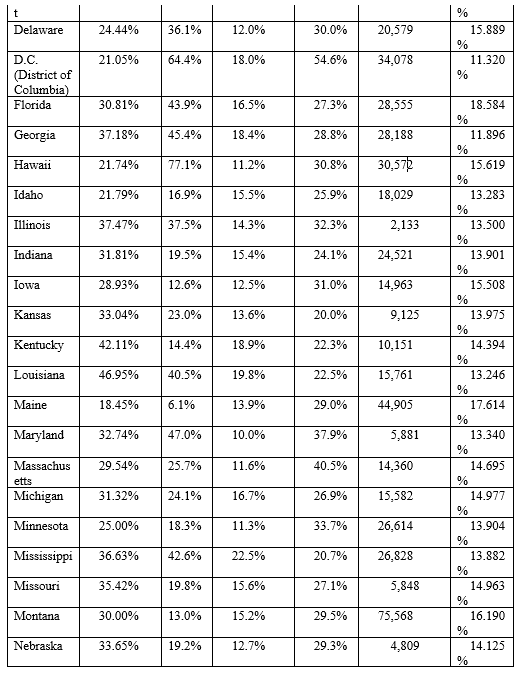
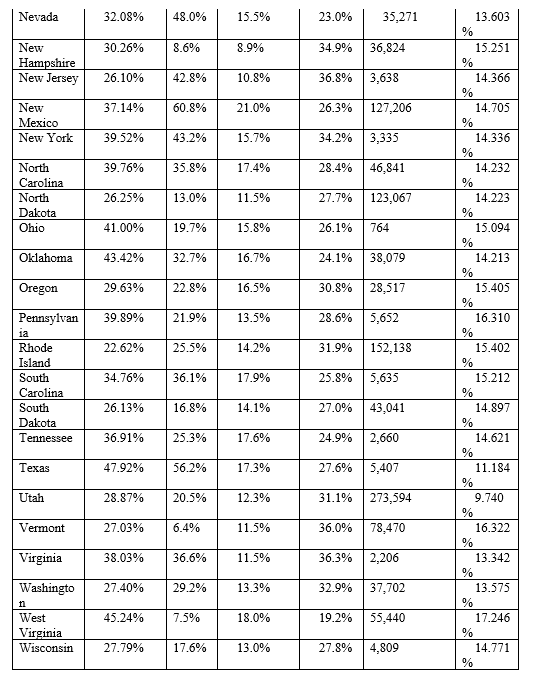

-Which group of states (including D.C.) listed below have the greatest proportion of minority citizens?
A) Hawaii, California and New Mexico
B) District of Columbia, Nevada and Maryland
C) Mississippi, New Jersey, Texas
D) None of the above
-Which group of states (including D.C.) listed below have the greatest proportion of minority citizens?
A) Hawaii, California and New Mexico
B) District of Columbia, Nevada and Maryland
C) Mississippi, New Jersey, Texas
D) None of the above
Question
Please answer the next several questions using Table 12.4 below which contains data for 2015.
-Which group of states (including D.C.) below have the greatest percentage of the population with 4 or more years of college:
A) Massachusetts, D.C., Colorado
B) Connecticut, Maryland, Rhode Island
C) Neither of the above
D) Data not provided
-Which group of states (including D.C.) below have the greatest percentage of the population with 4 or more years of college:
A) Massachusetts, D.C., Colorado
B) Connecticut, Maryland, Rhode Island
C) Neither of the above
D) Data not provided
Question
Please answer the next several questions using Table 12.4 below which contains data for 2015.
-The states with the greatest percent of persons age 65 and older are:
A) West Virginia and Florida
B) Florida and Maine
C) Neither of the above
D) Both of above
-The states with the greatest percent of persons age 65 and older are:
A) West Virginia and Florida
B) Florida and Maine
C) Neither of the above
D) Both of above
Question
Please answer the next several questions using Table 12.4 below which contains data for 2015.
-Which states (and the District of Columbia) listed below have the highest percentage of impoverished persons
A) Kentucky
B) Arkansas
C) New Mexico
D) Mississippi
-Which states (and the District of Columbia) listed below have the highest percentage of impoverished persons
A) Kentucky
B) Arkansas
C) New Mexico
D) Mississippi
Question
Question
Question
Question
The findings from the regression are listed in Tables 12.5 and 12.6


-This analysis tells us that:
A) As the percent of minorities in a state increased, the percent of 1 or 2 star nursing homes decreased but not significantly
B) As the percentage of the population who are impoverished increases in a state, the percentage of the nursing homes with one or 2 stars decreases
C) Both a and b
D) Neither a nor b
Question
The findings from the regression are listed in Tables 12.5 and 12.6
-The Summary Output sheets also inform us that:
A) As the percentage of the population with a 4-year degree or higher increases in a state, marginally significant decreases occur in the percent of 1 or 2 star facilities
B) As the per capita population per nursing home decreases, marginally significant increases occur in the percent of 1 or 2 star nursing homes in the state
C) The greater the percentage of the population who are 65 years of older occurs in the state, the percent of nursing homes with 1 or 2 stars decreases but not significantly
D) a and b are correct
E) b and c are correct
F) a, b, and c are correct
G) None of the above are correct

Unlock Deck
Sign up to unlock the cards in this deck!
Unlock Deck
Unlock Deck
1/41
Play
Full screen (f)
Deck 12: Disparities in Long-Term Care Institutions
1
According to the text and the Study Guide PowerPoint, technological advances are the single most important factor that has elevated life expectancy at birth in the United States to the point in which at least 25% of the American population are now age 65 or older.
False
2
According to the Study Guide PowerPoint, which statement or statements below is/are correct.
A) Long-term care institutions can be considered as the health care delivery system for all elderly Americans.
B) The clients or patients of long-term institutions only include persons who are 65 or older.
C) While elevated economic conditions have made the quality of life better for most Americans over time, it is the improvements in health care which have extended life:
D) a and b are true
E) b and ca art true
F) a, b and c are true
G) None of the above are true
G
3
The Study Guide PowerPoints expanded on Chapter12 by addressing the role of interval cell damage as a theory of aging. It was explained that interval cell damage refers to:
A) Cell damage that immediately occurs
B) Cell damage that occurs over time
C) a and b
D) None of the above
A) Cell damage that immediately occurs
B) Cell damage that occurs over time
C) a and b
D) None of the above
B
4
Which scenario listed below is most likely to create cell damage based upon your Study Guide PowerPoints.
A) Ms. Julia Brown is a 2 packs per day tobacco user and as a result, receives too little oxygen
B) Jeff Stuart, a single male of 34, purchases a beautiful newly constructed house near a landfill to the south of his property and a nuclear facility about one mile up the road
C) Both a and b
D) Neither a nor b
Unlock Deck
Unlock for access to all 41 flashcards in this deck.
Unlock Deck
k this deck
5
Cell damage or injury relates to long-term care because:
A) The greatest proportion of persons who require long-term care are the aged
B) Cell damage is one of the many theories of aging
C) a and b are both correct
D) None of the above are correct
A) The greatest proportion of persons who require long-term care are the aged
B) Cell damage is one of the many theories of aging
C) a and b are both correct
D) None of the above are correct
Unlock Deck
Unlock for access to all 41 flashcards in this deck.
Unlock Deck
k this deck
6
According to the Study Guide PowerPoints, cell injury or damage occurs when a cell injury occurs and the damage exceeds the rate at which new cells can be reproduced thereby leading to cell death or permanent cell injury and aging.
Unlock Deck
Unlock for access to all 41 flashcards in this deck.
Unlock Deck
k this deck
7
Based upon the text and the Study Guide PowerPoints, we know that "free radicals" can cause interval cell damage and, as a result, aging. The concept of free radicals is associated with the fields of:
A) Chemistry and Physics
B) Medicine and Pharmacology
C) Public Health and Health Care Administration
D) Information Technology and Computer Programming
A) Chemistry and Physics
B) Medicine and Pharmacology
C) Public Health and Health Care Administration
D) Information Technology and Computer Programming
Unlock Deck
Unlock for access to all 41 flashcards in this deck.
Unlock Deck
k this deck
8
Long-term care services refer to: 8.
A) All medical services delivered to persons age 65 or older
B) All health care and other services delivered to persons with age-related and/or other disabilities
C) All health care services delivered to the aged whether they have disabilities or not
D) a and b
E) b and c
F) a, b, and c
G) Neither a, b nor c
Unlock Deck
Unlock for access to all 41 flashcards in this deck.
Unlock Deck
k this deck
9
Key questions regarding the long-term care industry and disparities include each area below with the exception of:
A) Are there disparities in access to long-term by various subgroups?
B) Are there disparities in informal caregiving?
C) Are there disparities in elder abuse by subgroup?
D) None of the above. There are no exceptions.
E) All of the above are exceptions.
A) Are there disparities in access to long-term by various subgroups?
B) Are there disparities in informal caregiving?
C) Are there disparities in elder abuse by subgroup?
D) None of the above. There are no exceptions.
E) All of the above are exceptions.
Unlock Deck
Unlock for access to all 41 flashcards in this deck.
Unlock Deck
k this deck
10
Based upon your knowledge, understanding, and analysis of the definition of long-term care, which statements below are true?
A) The purpose of long-term care is to reverse, or cure the illness or disease or disability of the care recipient.
B) The purpose of long-term care is to address the physical, social, mental, psychological and spiritual needs of the persons served until their outcomes are reversed.
C) Both a and b
D) Neither a nor b
Unlock Deck
Unlock for access to all 41 flashcards in this deck.
Unlock Deck
k this deck
11
The long-term care industry includes a continuum of services ranging from those that are community-based to quasi-institutional providers to institutional providers. Which combination of services below are correctly matched with their service type?
A) Nursing home/quasi-institutional
B) Assisted living/community-based
C) Home health agencies/institutional
D) Adult day services/community-based
E) a and b
F) b and c
G) c and d
H) a, b, c and d
I) None of the above
A) Nursing home/quasi-institutional
B) Assisted living/community-based
C) Home health agencies/institutional
D) Adult day services/community-based
E) a and b
F) b and c
G) c and d
H) a, b, c and d
I) None of the above
Unlock Deck
Unlock for access to all 41 flashcards in this deck.
Unlock Deck
k this deck
12
Based upon your analysis of Table 12.1 below, which statement(s) is/are correct interpretations of the data in 12.1.
A) The greatest amount of patients in the long-term industry are served by home health agencies. This is not surprising since this segment of the industry has the greatest number of providers.
B) Based upon the number of nursing home residents and the number of nursing homes in 2013-2014, the mean number of residents per home was almost 88.
C) Adult day care providers were probably a struggling component of the long-term care industry since there were 4,800 providers with only 282,200 participants or, a mean of nearly 59 participants per provider unless daily rate was costly enough to cover all costs and generate a profit.
D) a and b
E) b and c
F) None of the above
G) All of the above
Unlock Deck
Unlock for access to all 41 flashcards in this deck.
Unlock Deck
k this deck
13
Informal caretaking is:
A) The 2nd most dominant form of long-term care
B) Considered as a win/win solution for the caretaker and the patient
C) a and b
D) None of the above
A) The 2nd most dominant form of long-term care
B) Considered as a win/win solution for the caretaker and the patient
C) a and b
D) None of the above
Unlock Deck
Unlock for access to all 41 flashcards in this deck.
Unlock Deck
k this deck
14
Disparities in informal caretaking exist. Which racial/ethnic group below has the highest probability of engaging in informal caregiving?
A) Asian Americans
B) White Americans
C) Latino Americans
D) African Americans
E) Native Americans
A) Asian Americans
B) White Americans
C) Latino Americans
D) African Americans
E) Native Americans
Unlock Deck
Unlock for access to all 41 flashcards in this deck.
Unlock Deck
k this deck
15
The same group in number 14 that has the highest proportion of informal caregivers also provide the longest number of hours per week in informal caregiving.
Unlock Deck
Unlock for access to all 41 flashcards in this deck.
Unlock Deck
k this deck
16
According to the text, which statement and/or statements below is/are true regarding the sex of informal caretakers:
A) Female caretakers spend considerably less time in caretaking activities than their male counterparts
B) Gender minorities rarely engage in caretaking because of stigma
C) Interestingly, no differences exist in the type of caretaking duties assumed by males and females
D) Approximately 25% of caretakers are males
Unlock Deck
Unlock for access to all 41 flashcards in this deck.
Unlock Deck
k this deck
17
Quantitatively speaking, Table 12.2 reveals that:
TABLE 12.2 Informal Caregiving Differences by Race/Ethnicity, 2015
A) A greater percentage of Latino Americans provide informal long-term than any other ethnic group listed. A greater percentage of Latinos also provide 30 hours more of care per week than any other racial/ethnic group
B) A lower percent of Asian Americans provide informal long-term care than any other group. However, the Asian Americans have the second highest proportion of caretakers who spend a mean of 30 hours or more.
C) The percentage differences between the mean age of caretakers for Americans of European descent and those of African descent is less than 5%
D) a and b
E) b and c
F) a, b and c are true
G) None of the above are true
Unlock Deck
Unlock for access to all 41 flashcards in this deck.
Unlock Deck
k this deck
18
The mean age of all caretakers independently of race/ethnicity, sex or sexual preference is 18-49 years.
Unlock Deck
Unlock for access to all 41 flashcards in this deck.
Unlock Deck
k this deck
19
Elder abuse is most likely to be committed by the spouse or by the child of the patient.
Unlock Deck
Unlock for access to all 41 flashcards in this deck.
Unlock Deck
k this deck
20
Which services below can support informal caretakers in their efforts?
A) Accessing any services will decrease depression in caretakers according to Sibalija (2017) and Klein (2016)
B) Telephonic support, however, is not effective according to Lopez-Hartmann et al (2012)
C) Adult day care is one form of respite service that decreases negative effects of caretaking according to Boccuti et al. (2015)
D) a and b
E) b and c
F) a, b and c are correct
G) None of the above are correct
Unlock Deck
Unlock for access to all 41 flashcards in this deck.
Unlock Deck
k this deck
21
While community-based services such as adult day care centers and services brought into the home such as homemaker health aides services as well as quasi-institutional services and other services are a part of the long-term care continuum, nursing homes are considered by many as the very foundation of the long-term care system. Which statement/statements below were accurate for nursing homes in 2015?
A) There were more than 20,000 nursing homes serving more than 1.3 million persons
B) Approximately 30% of nursing homes were operated as nonprofits
C) Approximately 71% of nursing homes were moderate and/or small in size
D) a and b
E) b and c
F) All of the above
G) None of the above
A) There were more than 20,000 nursing homes serving more than 1.3 million persons
B) Approximately 30% of nursing homes were operated as nonprofits
C) Approximately 71% of nursing homes were moderate and/or small in size
D) a and b
E) b and c
F) All of the above
G) None of the above
Unlock Deck
Unlock for access to all 41 flashcards in this deck.
Unlock Deck
k this deck
22
Nursing Home Compare is the premiere database that collects data on nursing home quality. Which statements below are correct based upon your reading and analysis of Chapter 12:
A) In 2015, approximately 59% of residents lived in nursing home with three (3) or fewer stars
B) Approximately 19% of residents lived in facilities with 3 stars
C) Both a and b are correct
D) Neither a nor b are correct
A) In 2015, approximately 59% of residents lived in nursing home with three (3) or fewer stars
B) Approximately 19% of residents lived in facilities with 3 stars
C) Both a and b are correct
D) Neither a nor b are correct
Unlock Deck
Unlock for access to all 41 flashcards in this deck.
Unlock Deck
k this deck
23
No disparities exist in nursing homes care between males and females in long-term care in countries outside of the U.S.
Unlock Deck
Unlock for access to all 41 flashcards in this deck.
Unlock Deck
k this deck
24
What are some variables according to the researchers cited in the text that lead to disparities in nursing home care?
A) Higher levels of need
B) Choosing to place family member into nursing homes that have low ratings
C) Placing family members in nursing homes in which the Nursing Home Administrators and/or Directors of Nursing have lower levels of education and fewer certifications
D) a and b
E) b and c
F) a, b, and c
G) None of the above
Unlock Deck
Unlock for access to all 41 flashcards in this deck.
Unlock Deck
k this deck
25
Nursing home quality measurements are linked to indicators from Donabedian's model (1985) which is based upon:
A) Micro-level variables that characterize each nursing home's individual structure, process and outcomes
B) Macro-level variables such as the characteristics, income, and education of the state's population from which residents are drawn
C) None of the above
D) Both a and b
A) Micro-level variables that characterize each nursing home's individual structure, process and outcomes
B) Macro-level variables such as the characteristics, income, and education of the state's population from which residents are drawn
C) None of the above
D) Both a and b
Unlock Deck
Unlock for access to all 41 flashcards in this deck.
Unlock Deck
k this deck
26
The purpose of the original quantitative case study completed in the text was that of assessing:
A) Whether characteristics of each nursing home affects a 4 or 5 star rating
B) Whether characteristics of the population of each state are associated with the % of the nursing homes in the state that receive 1 or 2 star ratings
C) Both a and b
D) Neither a nor b
A) Whether characteristics of each nursing home affects a 4 or 5 star rating
B) Whether characteristics of the population of each state are associated with the % of the nursing homes in the state that receive 1 or 2 star ratings
C) Both a and b
D) Neither a nor b
Unlock Deck
Unlock for access to all 41 flashcards in this deck.
Unlock Deck
k this deck
27
What was the source of the data on nursing homes with one or two stars ratings in 2015:
A) Census data
B) Nursing Home Compare data
C) Hospital Compare data
D) None of the above
E) All of the above
A) Census data
B) Nursing Home Compare data
C) Hospital Compare data
D) None of the above
E) All of the above
Unlock Deck
Unlock for access to all 41 flashcards in this deck.
Unlock Deck
k this deck
28
Before utilizing a data source, it is necessary to:
A) First, read how the data were collected
B) Second, engage in data validation and verification
C) Both a and b
D) Neither a nor b
A) First, read how the data were collected
B) Second, engage in data validation and verification
C) Both a and b
D) Neither a nor b
Unlock Deck
Unlock for access to all 41 flashcards in this deck.
Unlock Deck
k this deck
29
Please review the table from the Appendix to this chapter which has been included below. Then answer the questions to assess whether you are correctly reading and interpreting the data.
-The states with the greatest number of nursing homes in 2015 were:
A) California, Texas, and Florida
B) Ohio, Texas, and Florida
C) Illinois, Texas and Florida
D) None of the above
-The states with the greatest number of nursing homes in 2015 were:
A) California, Texas, and Florida
B) Ohio, Texas, and Florida
C) Illinois, Texas and Florida
D) None of the above
Unlock Deck
Unlock for access to all 41 flashcards in this deck.
Unlock Deck
k this deck
30
Please review the table from the Appendix to this chapter which has been included below. Then answer the questions to assess whether you are correctly reading and interpreting the data.
-Approximately __% of the nursing homes had 4 or 5 star ratings.
A) 22.94%
B) 23.51%
C) 46.46%
D) None of the above
-Approximately __% of the nursing homes had 4 or 5 star ratings.
A) 22.94%
B) 23.51%
C) 46.46%
D) None of the above
Unlock Deck
Unlock for access to all 41 flashcards in this deck.
Unlock Deck
k this deck
31
Please review the table from the Appendix to this chapter which has been included below. Then answer the questions to assess whether you are correctly reading and interpreting the data.
-The percentage of nursing homes with 4 of 5 star ratings:
A) Was less than the percentage with 1 or 2 star ratings
B) Was more than the percentage with 1 or 2 star ratings
C) Was equal to the percentage with 1 or 2 star ratings
D) None of the above
-The percentage of nursing homes with 4 of 5 star ratings:
A) Was less than the percentage with 1 or 2 star ratings
B) Was more than the percentage with 1 or 2 star ratings
C) Was equal to the percentage with 1 or 2 star ratings
D) None of the above
Unlock Deck
Unlock for access to all 41 flashcards in this deck.
Unlock Deck
k this deck
32
Please review the table from the Appendix to this chapter which has been included below. Then answer the questions to assess whether you are correctly reading and interpreting the data.
-The objective of the quantitative case study in Chapter 12 is to:
A) Demonstrate how to take data and convert it into information and to convert the information into new knowledge
B) Ensure that students see how badly the nursing home industry is performing
C) Both a and b
D) None of the above
-The objective of the quantitative case study in Chapter 12 is to:
A) Demonstrate how to take data and convert it into information and to convert the information into new knowledge
B) Ensure that students see how badly the nursing home industry is performing
C) Both a and b
D) None of the above
Unlock Deck
Unlock for access to all 41 flashcards in this deck.
Unlock Deck
k this deck
33
Please answer the next several questions using Table 12.4 below which contains data for 2015.
-Which group of states (including D.C.) listed below have the greatest proportion of minority citizens?
A) Hawaii, California and New Mexico
B) District of Columbia, Nevada and Maryland
C) Mississippi, New Jersey, Texas
D) None of the above
-Which group of states (including D.C.) listed below have the greatest proportion of minority citizens?
A) Hawaii, California and New Mexico
B) District of Columbia, Nevada and Maryland
C) Mississippi, New Jersey, Texas
D) None of the above
Unlock Deck
Unlock for access to all 41 flashcards in this deck.
Unlock Deck
k this deck
34
Please answer the next several questions using Table 12.4 below which contains data for 2015.
-Which group of states (including D.C.) below have the greatest percentage of the population with 4 or more years of college:
A) Massachusetts, D.C., Colorado
B) Connecticut, Maryland, Rhode Island
C) Neither of the above
D) Data not provided
-Which group of states (including D.C.) below have the greatest percentage of the population with 4 or more years of college:
A) Massachusetts, D.C., Colorado
B) Connecticut, Maryland, Rhode Island
C) Neither of the above
D) Data not provided
Unlock Deck
Unlock for access to all 41 flashcards in this deck.
Unlock Deck
k this deck
35
Please answer the next several questions using Table 12.4 below which contains data for 2015.
-The states with the greatest percent of persons age 65 and older are:
A) West Virginia and Florida
B) Florida and Maine
C) Neither of the above
D) Both of above
-The states with the greatest percent of persons age 65 and older are:
A) West Virginia and Florida
B) Florida and Maine
C) Neither of the above
D) Both of above
Unlock Deck
Unlock for access to all 41 flashcards in this deck.
Unlock Deck
k this deck
36
Please answer the next several questions using Table 12.4 below which contains data for 2015.
-Which states (and the District of Columbia) listed below have the highest percentage of impoverished persons
A) Kentucky
B) Arkansas
C) New Mexico
D) Mississippi
-Which states (and the District of Columbia) listed below have the highest percentage of impoverished persons
A) Kentucky
B) Arkansas
C) New Mexico
D) Mississippi
Unlock Deck
Unlock for access to all 41 flashcards in this deck.
Unlock Deck
k this deck
37
Because the demographic and socioeconomic composition of a state comprises the human environment from which nursing home residents are drawn, this case study hypothesizes that these factors may affect the percentage of nursing homes with one or two stars.
Unlock Deck
Unlock for access to all 41 flashcards in this deck.
Unlock Deck
k this deck
38
What was used as the analytical approach?
A) A correlation coefficient was calculated
B) Multiple regression was used
C) Logistic regression was used
D) Chi-Square analysis was used
A) A correlation coefficient was calculated
B) Multiple regression was used
C) Logistic regression was used
D) Chi-Square analysis was used
Unlock Deck
Unlock for access to all 41 flashcards in this deck.
Unlock Deck
k this deck
39
Excel can be used to "run" a regression.
Unlock Deck
Unlock for access to all 41 flashcards in this deck.
Unlock Deck
k this deck
40
The findings from the regression are listed in Tables 12.5 and 12.6
-This analysis tells us that:
A) As the percent of minorities in a state increased, the percent of 1 or 2 star nursing homes decreased but not significantly
B) As the percentage of the population who are impoverished increases in a state, the percentage of the nursing homes with one or 2 stars decreases
C) Both a and b
D) Neither a nor b
Unlock Deck
Unlock for access to all 41 flashcards in this deck.
Unlock Deck
k this deck
41
The findings from the regression are listed in Tables 12.5 and 12.6
-The Summary Output sheets also inform us that:
A) As the percentage of the population with a 4-year degree or higher increases in a state, marginally significant decreases occur in the percent of 1 or 2 star facilities
B) As the per capita population per nursing home decreases, marginally significant increases occur in the percent of 1 or 2 star nursing homes in the state
C) The greater the percentage of the population who are 65 years of older occurs in the state, the percent of nursing homes with 1 or 2 stars decreases but not significantly
D) a and b are correct
E) b and c are correct
F) a, b, and c are correct
G) None of the above are correct
Unlock Deck
Unlock for access to all 41 flashcards in this deck.
Unlock Deck
k this deck
Unlock Deck
Unlock for access to all 41 flashcards in this deck.


