Use the following to answer question: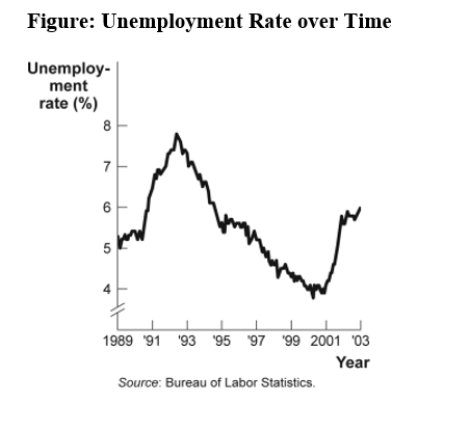
-(Figure: Unemployment Rate over Time) Use Figure: Unemployment Rate over Time.In the time-series graph,as we move from 1993 to 1995,we see that the unemployment rate has _____ from approximately _____% to approximately _____%.
A) decreased;5;4
B) increased;5.3;7.3
C) decreased;7;5.5
D) increased;4;6.3
Correct Answer:
Verified
Q50: The fact that two variables always move
Q51: In looking at a chart of the
Q52: A bar graph:
A)is useful when showing what
Q53: A positive relationship between swimsuits purchased and
Q54: A _ graph shows how the value
Q55: In a time-series graph,large changes can be
Q56: The owner of the Dismal Philosopher,one of
Q57: Taylor sees a bar graph showing the
Q59: The scaling of the axes of a
Q60: Use the following to answer question:
Unlock this Answer For Free Now!
View this answer and more for free by performing one of the following actions

Scan the QR code to install the App and get 2 free unlocks

Unlock quizzes for free by uploading documents