Use the following to answer question: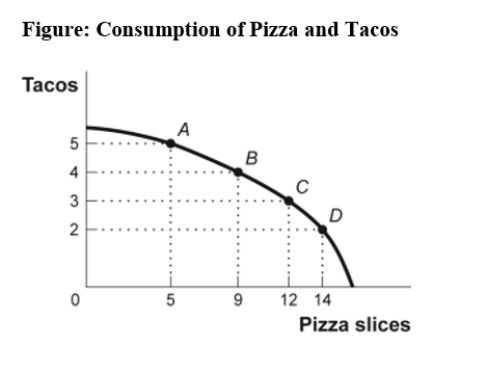
-(Figure: Consumption of Pizza and Tacos)Use Figure: Consumption of Pizza and Tacos.The figure shows the number of tacos and pizza slices Matt can eat in a day.The best estimate of the slope between point A and point B is -4.
Correct Answer:
Verified
Q50: The fact that two variables always move
Q51: In looking at a chart of the
Q52: A bar graph:
A)is useful when showing what
Q53: A positive relationship between swimsuits purchased and
Q54: A _ graph shows how the value
Q55: In a time-series graph,large changes can be
Q56: The owner of the Dismal Philosopher,one of
Q57: Taylor sees a bar graph showing the
Q58: Use the following to answer question:
Q59: The scaling of the axes of a
Unlock this Answer For Free Now!
View this answer and more for free by performing one of the following actions

Scan the QR code to install the App and get 2 free unlocks

Unlock quizzes for free by uploading documents