Multiple Choice
In the cardiac and vascular function curves shown below,the solid curves represent the control state: 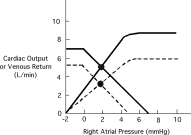 The shift in these curves,illustrated by the dashed lines,is best explained by:
A) Administration of positive inotropic agent.
B) Decrease in peripheral vascular resistance.
C) Infusion of isotonic saline.
D) Increase in peripheral vascular resistance.
E) Administration of a negative inotropic agent.
Correct Answer:
Verified
Related Questions
Unlock this Answer For Free Now!
View this answer and more for free by performing one of the following actions

Scan the QR code to install the App and get 2 free unlocks

Unlock quizzes for free by uploading documents