Multiple Choice
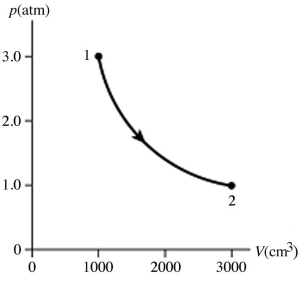
The figure shows a pV diagram for 0.95 mol of gas that undergoes the process 1 → 2.The gas then undergoes an isochoric heating from point 2 until the pressure is restored to the value it had at point 1.What is the final temperature of the gas? The ideal gas constant is R = 8.314 J/mol ∙ K = 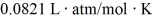 .
. 
A) -160°C
B) 15°C
C) 390°C
D) 120°C
Correct Answer:
Verified
Related Questions
Q36: Sometimes an experiment requires a certain pure
Q37: What is the mass density of argon
Q38: A 3.2-L volume of neon gas (Ne)is
Q39: A cold trap is set up to
Unlock this Answer For Free Now!
View this answer and more for free by performing one of the following actions

Scan the QR code to install the App and get 2 free unlocks

Unlock quizzes for free by uploading documents