Exhibit 29-5 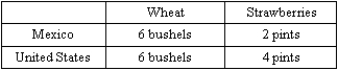
-Refer to Exhibit 29-5.Suppose that the following table represents the production of wheat and strawberries per unit of labor in the United States and Mexico:
(A)Which country has a comparative advantage in wheat production? Why?
(B)Which country has an absolute advantage in wheat? in strawberries? Why?
(C)With free trade between the United States and Mexico,is it possible that 1 bushel of wheat will trade for 1 pint of strawberries? Why or why not?
(D)Suppose the free trade price is 2 bushels of wheat for 1 pint of strawberries.Draw a diagram indicating the production possibilities curve with and without trade if the United States has 100 million units of labor.How much of each good will the United States produce?
Correct Answer:
Verified
View Answer
Unlock this answer now
Get Access to more Verified Answers free of charge
Q106: Was the rationale for the North American
Q123: A policy that restricts trade to protect
Q124: The intersection of the export supply curve
Q126: A curve showing the quantity of imports
Q129: The oldest and most common method for
Q130: Suppose that each firm in an industry
Q132: Explain whether the following statements are true
Q133: It takes Gail two hours to mow
Q136: Using the price/cost per unit analysis diagram
Q137: The United States imports more manufactured goods
Unlock this Answer For Free Now!
View this answer and more for free by performing one of the following actions

Scan the QR code to install the App and get 2 free unlocks

Unlock quizzes for free by uploading documents