Use the graph to answer the following questions. 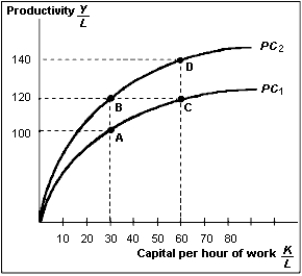 (A)Suppose that between two given years, growth in capital per hour of work and growth in technology were both positive. Pick two points on the graph that represent such a scenario.
(B)Suppose that between two given years, growth in capital per hour of work was zero, and growth in technology was positive. Pick two points on the graph that represent such a scenario.
(C)Suppose that between two given years, growth in capital per hour of work was positive, and growth in technology was negative. Pick two points on the graph that represent such a scenario. What happened to productivity in this particular case?
Correct Answer:
Verified
Q2: In the formula Q3: In the formula Q5: Between 1975 and 1993,most of the increase Q5: Suppose the production function Y = f(K,L) Unlock this Answer For Free Now! View this answer and more for free by performing one of the following actions Scan the QR code to install the App and get 2 free unlocks Unlock quizzes for free by uploading documents![]()
![]()

