Multiple Choice
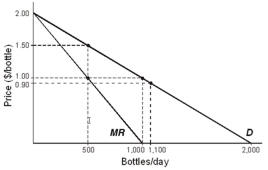
-Suppose the market demand curve shown in the diagram above represents a cartel's demand curve.Given zero marginal cost,we expect the market price to be ___,with ____ bottles of water sold per day.
A) $2.00;2,000
B) $2.00;1,000
C) $1.50;500
D) $1.00;1,000
E) $1.00;500
Correct Answer:
Verified
Related Questions
Q51: Q52: In the cola industry,all existing firms spend Q53: A cartel's profit-maximizing price and output will Q54: Three firms join forces and form a![]()
Unlock this Answer For Free Now!
View this answer and more for free by performing one of the following actions

Scan the QR code to install the App and get 2 free unlocks

Unlock quizzes for free by uploading documents