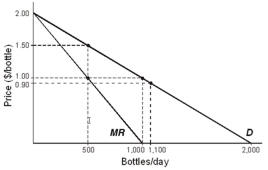
-Suppose the demand curve shown in the diagram above represents the demand curve for a profit-maximizing cartel with two rival firms of equal size and efficiency,each with zero marginal cost.If the market price is currently set at $1.00 and it is difficult to detect price-altering activities,the dominant strategy for each firm is to
A) raise price to gain market share.
B) lower price in order to increase society's surplus.
C) lower price in order to increase its profit.
D) lower price in order to capture the entire market.
E) lower price both in order to increase its profit and to capture the entire market.
Correct Answer:
Verified
Q46: For a game involving players A and
Q47: One of the reasons why a wheat
Q48: The payoff matrix below shows the extra
Q49: Q50: Two competitive firms are located side by Q52: In the cola industry,all existing firms spend Q53: A cartel's profit-maximizing price and output will Q54: Three firms join forces and form a Q55: Q56: Unlock this Answer For Free Now! View this answer and more for free by performing one of the following actions Scan the QR code to install the App and get 2 free unlocks Unlock quizzes for free by uploading documents![]()
![]()
![]()

