Multiple Choice
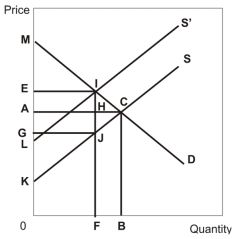 In the diagram above,D represents the original demand curve,S represents the original supply curve,and S' represents the supply curve once a per-unit tax is imposed.
-Refer to the diagram above.Consumer surplus after the tax is imposed is represented by the area
A) MAC.
B) MEI.
C) MAHI.
D) EAHI.
E) EACI.
Correct Answer:
Verified
Related Questions

