Multiple Choice
 In the diagram above,D represents the original demand curve,S represents the original supply curve,and S' represents the supply curve once a per-unit tax is imposed.
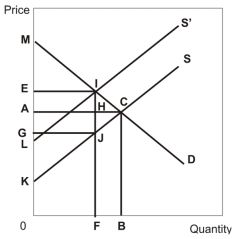
-Refer to the diagram above.The loss in efficiency due to the tax is represented by the area______ and stems from ______.
A) IJC;the trades that do not occur because of the tax
B) IHC;consumer unrest about higher prices
C) HJC;producer dissatisfaction with lower revenue
D) EGJI;wasteful use of the tax revenue by government
E) EAHI;consumer resentment over taxation
Correct Answer:
Verified
Related Questions

