The arrows in Figures A–D represent possible movements of the exchange rate (euros per U.S. dollar) and the quantity of U.S. dollars buyers are willing and able to buy. Use these figures to answer the following questions. 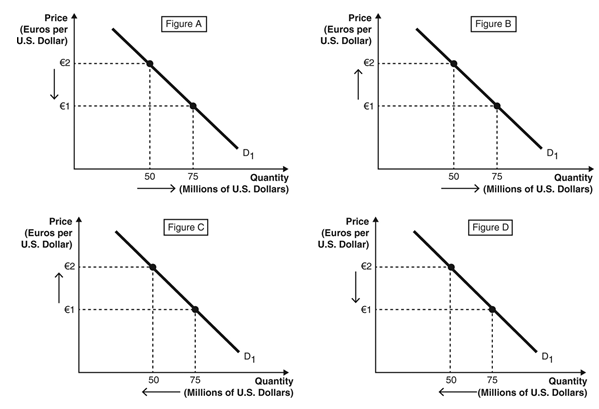
-A depreciation of the euro against the U.S.dollar is represented by Figure ________,and a depreciation of the U.S.dollar against the euro is represented by Figure ________.
A) A; C
B) C; A
C) B; D
D) D; B
E) A; D
Correct Answer:
Verified
Q41: A national government or central bank can
Q42: The following figure depicts the supply of
Q43: The following figure depicts the supply of
Q44: The following two figures depict the demand
Q45: The following figure depicts the demand for
Q47: The figure below depicts the three possible
Q48: The figure below depicts the supply of
Q49: The following two figures depict the demand
Q50: In the foreign currency market,the supply of
Q51: Figure A below depicts the demand and
Unlock this Answer For Free Now!
View this answer and more for free by performing one of the following actions

Scan the QR code to install the App and get 2 free unlocks

Unlock quizzes for free by uploading documents