Figure A below depicts the demand and supply of Japanese yen in the foreign currency exchange market. Figure B below depicts the aggregate supply–aggregate demand model for the Japanese economy. Use these figures to answer the following questions. 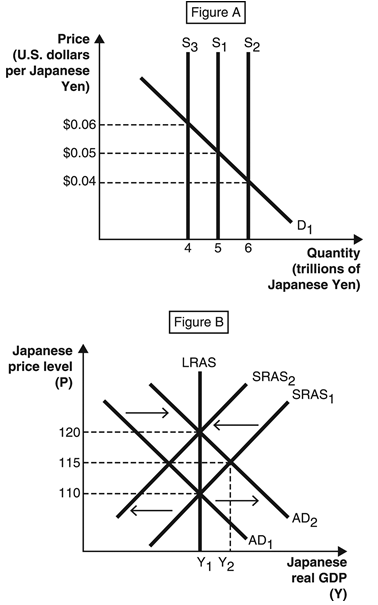
-Which of the following is the most accurate description of the phenomenon shown in Figure B?
A) The Japanese central bank increased the money supply S1 to S2,which caused the price level to fall from 115 to 110,which then caused the short-run aggregate supply to decrease from SRAS1 to SRAS2.
B) The Japanese central bank increased the money supply S1 to S2,which caused aggregate demand to increase from AD1 to AD2,which then caused the short-run aggregate supply to decrease from SRAS1 to SRAS2.
C) The Japanese central bank decreased the money supply S1 to S3,which caused aggregate demand to decrease from AD2 to AD1,which then caused the short-run aggregate supply to decrease from SRAS1 to SRAS2.
D) The Japanese central bank increased the money supply S1 to S2,which caused real gross domestic product (GDP) to fall from Y2 to Y1,which caused the short-run aggregate supply to decrease from SRAS1 to SRAS2,which then caused aggregate demand to increase from AD1 to AD2.
E) Aggregate demand increased from AD1 to AD2,which forced the Japanese central bank to increase the money supply S1 to S2,which then caused the short-run aggregate supply to decrease from SRAS1 to SRAS2.
Correct Answer:
Verified
Q46: The arrows in Figures A–D represent possible
Q47: The figure below depicts the three possible
Q48: The figure below depicts the supply of
Q49: The following two figures depict the demand
Q50: In the foreign currency market,the supply of
Q52: Figure A below depicts the demand and
Q53: The following figure depicts the demand for
Q54: The following figure depicts the demand for
Q55: The following two figures depict the demand
Q56: If interest rates in Australia decrease relative
Unlock this Answer For Free Now!
View this answer and more for free by performing one of the following actions

Scan the QR code to install the App and get 2 free unlocks

Unlock quizzes for free by uploading documents