Table 15-2
Given the sample results (100 units in each sample) :
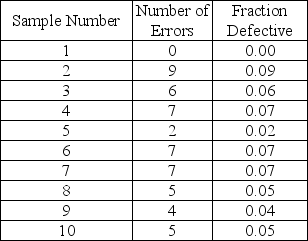
-Based on Table 15-2, find the 95.5% lower limit of the appropriate p-chart.
A) 0.0076
B) 0.0964
C) 0.2014
D) 0.1397
Correct Answer:
Verified
Q58: Defects in the finish of new, custom
Q59: Table 15-1 Q60: A plant manager is concerned with the Q61: The standard deviation of a process can Q62: Joe studied his control chart and noticed Q64: A company has been receiving complaints about Q65: Which of these patterns on a control Q66: The c-chart is useful when we Q67: A company has been receiving complaints about Q68: Table 15-1
![]()
A)take a
![]()
Unlock this Answer For Free Now!
View this answer and more for free by performing one of the following actions

Scan the QR code to install the App and get 2 free unlocks

Unlock quizzes for free by uploading documents